October 30, 2025 a 12:46 pm
KEY: Dividend Analysis - KeyCorp
KeyCorp presents an intriguing investment opportunity with a substantial history of dividend payments and a consistent dividend yield. With 39 years of reliable dividend history, the company demonstrates a stable payout approach. However, the high EPS-based payout ratio may pose a concern regarding the sustainability of future dividends.
📊 Overview
KeyCorp operates primarily within the Financial sector. The company's current dividend yield stands at 4.32%, with a dividend per share of 0.98 USD. Over the last 39 years, KeyCorp has maintained a consistent dividend history, with no recent cuts or suspensions.
| Sector | Dividend Yield (%) | Current Dividend Per Share (USD) | Dividend History (Years) | Last Cut or Suspension |
|---|---|---|---|---|
| Financial | 4.32 | 0.98 | 39 | None |
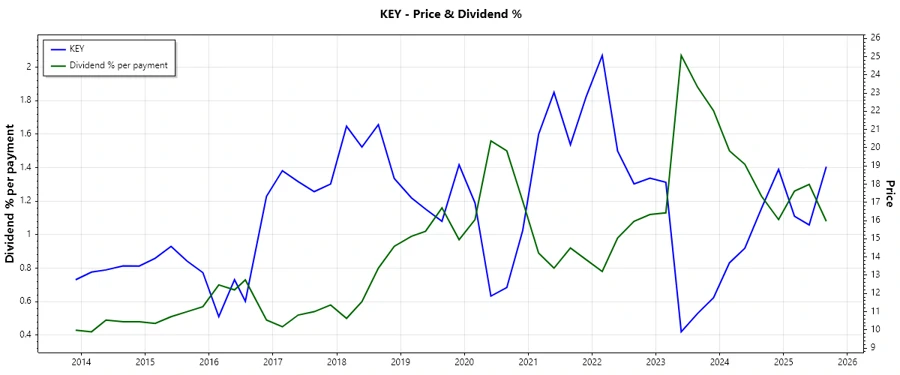
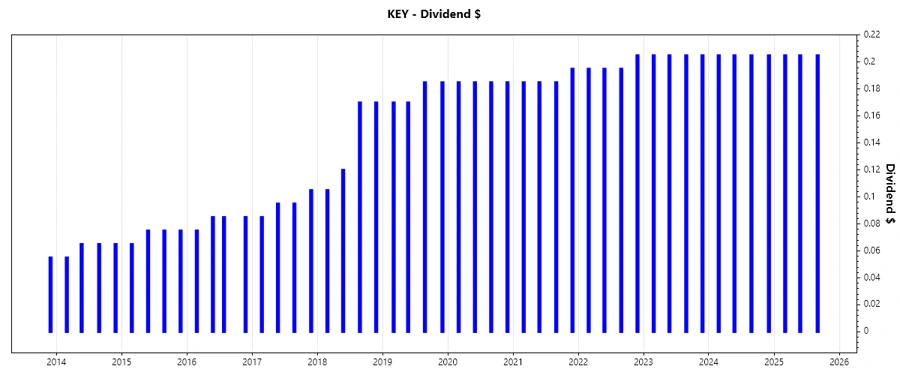
📈 Dividend History
Understanding a company's dividend history is crucial for assessing its commitment to returning capital to shareholders. KeyCorp's long-standing dividend payments signify a robust commitment, with the most recent dividends remaining relatively stable.
| Year | Dividend Per Share (USD) |
|---|---|
| 2025 | 0.615 |
| 2024 | 0.820 |
| 2023 | 0.820 |
| 2022 | 0.790 |
| 2021 | 0.750 |
📉 Dividend Growth
Dividend growth rates provide insight into a company's financial health and its ability to return excess capital to shareholders. KeyCorp's average dividend growth over the past 5 years is moderate at approximately 2.92%.
| Time | Growth (%) |
|---|---|
| 3 years | 3.02 |
| 5 years | 2.92 |
The average dividend growth is 2.92% over 5 years. This shows moderate but steady dividend growth.
✅ Payout Ratio
Payout Ratios are critical in assessing the sustainability of a company's dividends. High ratios can indicate potential difficulties in maintaining dividend levels during downturns.
| Key Figure | Ratio (%) |
|---|---|
| EPS-based | 99.97 |
| Free cash flow-based | 38.71 |
The EPS-based payout ratio of 99.97% is concerning as it suggests that nearly all earnings are being paid out as dividends, which could pressure future dividend sustainability. In contrast, the free cash flow-based ratio of 38.71% presents a more balanced resource utilization.
📊 Cashflow & Capital Efficiency
An analysis of cashflow and capital efficiency gives better insight into a company's operational efficiency and its ability to generate cash. KeyCorp exhibits notable differences in earnings and cash flow yields year-over-year, with wide variability in capital expenditure and stock-based compensation.
| 2024 | 2023 | 2022 | |
|---|---|---|---|
| Free Cash Flow Yield | 3.68% | 20.68% | 27.08% |
| Earnings Yield | -0.98% | 7.24% | 11.90% |
| CAPEX to Operating Cash Flow | 9.79% | 4.89% | 2.42% |
| Stock-based Compensation to Revenue | 1.15% | 1.18% | 1.52% |
| Free Cash Flow / Operating Cash Flow Ratio | 0.90% | 0.95% | 0.98% |
The data reflects fluctuating cash flow yields and capital metrics, indicating potential challenges in capital allocation and cost optimization strategies. While operating cash flow coverage remains satisfactory, significant CAPEX variation could impact future liquidity and operational flexibility.
📊 Balance Sheet & Leverage Analysis
Evaluating balance sheet strength and leverage provides insights into a company's financial stability and its ability to manage debt. KeyCorp's debt ratios highlight substantial financial leverage, albeit with manageable coverage levels in recent years.
| 2024 | 2023 | 2022 | |
|---|---|---|---|
| Debt-to-Equity | 0.78 | 1.55 | 2.14 |
| Debt-to-Assets | 0.08 | 0.12 | 0.15 |
| Debt-to-Capital | 0.44 | 0.61 | 0.68 |
| Net Debt to EBITDA | 8.20 | 16.52 | 11.17 |
| Current Ratio | 31.66 | 0.35 | 0.30 |
| Quick Ratio | 0.17 | 0.35 | 0.30 |
| Financial Leverage | 10.30 | 12.86 | 14.11 |
KeyCorp's leverage ratios present risk through high financial leverage, yet improved debt management in recent years suggests progress towards enhanced balance sheet resilience. The current ratio appears unusually high for 2024, likely reflecting a reclassification of liabilities or significant liquid asset accumulation.
📊 Fundamental Strength & Profitability
Key performance metrics for profitability and fundamental strength provide a valuable picture of KeyCorp's operational success and financial health over time. Despite recent fluctuations, there are positive trends in specific metrics.
| 2024 | 2023 | 2022 | |
|---|---|---|---|
| Return on Equity | -0.89% | 6.61% | 14.25% |
| Return on Assets | -0.09% | 0.51% | 1.01% |
| Margins: Net | -1.78% | 9.45% | 24.23% |
| EBIT Margin | -3.38% | 11.34% | 29.49% |
| EBITDA Margin | -2.57% | 12.85% | 31.56% |
| Gross Margin | 44.81% | 55.98% | 82.47% |
| R&D to Revenue | 0% | 0% | 0% |
Overall profitability has exhibited variability, with significant margin expansions in 2023 to 2022, but 2024 marked a contraction into negative territory, possibly indicating operational restructuring or financial difficulties. The lack of R&D investment could be concerning for future growth prospects.
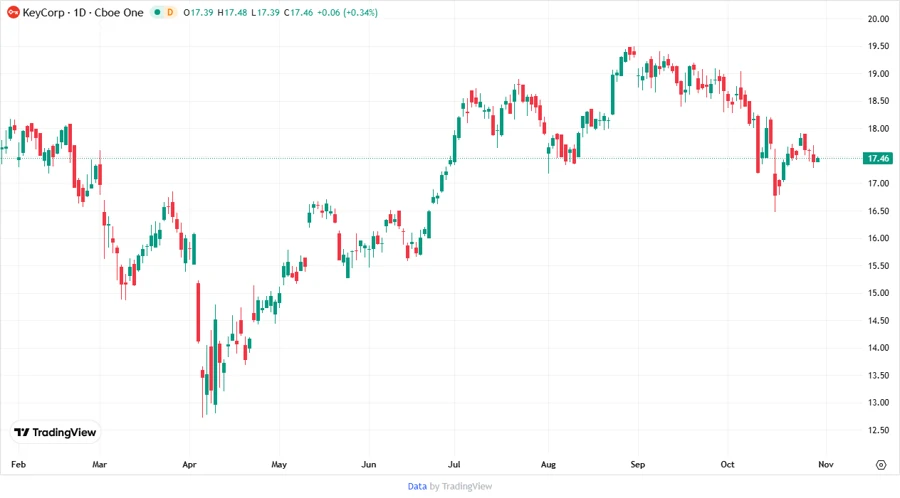
📊 Price Development
🗣️ Dividend Scoring System
| Criteria | Score | Score Bar |
|---|---|---|
| Dividend Yield | 4 | |
| Dividend Stability | 5 | |
| Dividend Growth | 3 | |
| Payout Ratio | 2 | |
| Financial Stability | 3 | |
| Dividend Continuity | 5 | |
| Cashflow Coverage | 3 | |
| Balance Sheet Quality | 2 |
Overall Score: 27/40
✅ Rating
KeyCorp offers a compelling dividend opportunity underlined by its extensive history of dividend payments and respectable yield. While the payout ratio poses significant risks, the company’s commitment to consistent dividends and recent improvements in leverage are promising. Investors should consider the high EPS payout ratio, as it could limit growth potential, and watch for future profit margin stabilization to affirm the viability of its dividend strategy.
Smart Data Insight
Master the Perfect Entry & Exit for this Stock
Don't leave your profits to chance. Historically, this stock follows specific seasonal patterns that institutional traders use to maximize returns.
- ✅ Identify the "Golden Buying Window"
- ✅ Avoid high-risk correction cycles
- ✅ Backtested data from the last 20+ years