September 12, 2025 a 08:15 am
KEYS: Trend and Support & Resistance Analysis - Keysight Technologies, Inc.
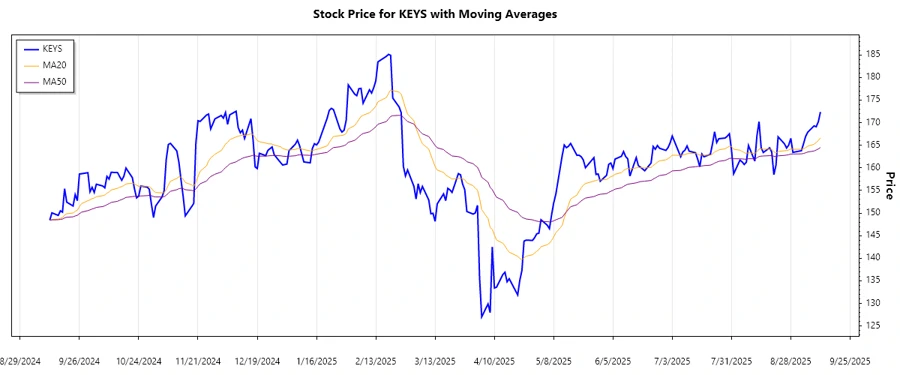
Keysight Technologies, Inc., operating in electronic design and test solutions for various industries, has demonstrated varied stock behavior over recent months. An analysis of recent market trends, their closing values, and support/resistance levels provides insights into the potential future movement of KEYS stock. Investors must consider these technical indicators to make informed decisions.
Trend Analysis
| Date | Closing Price | Trend |
|---|---|---|
| 2025-09-11 | 172.37 | ▲ Uptrend |
| 2025-09-10 | 170.21 | ▲ Uptrend |
| 2025-09-09 | 169.10 | ▲ Uptrend |
| 2025-09-08 | 169.29 | ▲ Uptrend |
| 2025-09-05 | 167.90 | ▲ Uptrend |
| 2025-09-04 | 166.95 | ▲ Uptrend |
| 2025-09-03 | 165.32 | ▲ Uptrend |
The analysis shows a consistent upward trend supported by recent data with the EMA20 moving above the EMA50, indicating strong investor interest and potential growth.
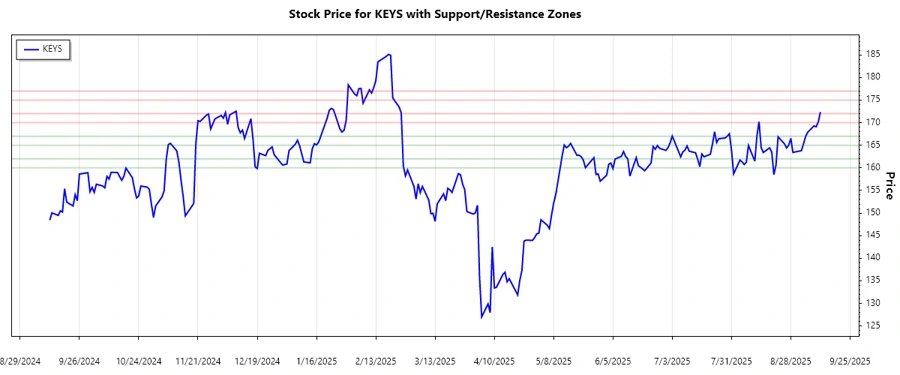
Support and Resistance
| Zone | Level |
|---|---|
| ⚑ Support Zone 1 | 165.00 - 167.00 |
| ⚑ Support Zone 2 | 160.00 - 162.00 |
| ⚐ Resistance Zone 1 | 170.00 - 172.00 |
| ⚐ Resistance Zone 2 | 175.00 - 177.00 |
Currently, the stock is oscillating close to the resistance of 170.00 - 172.00, which could yield a breakout if it exceeds this zone, potentially targeting the higher resistance levels.
Conclusion
The analysis indicates an intact upward trend for Keysight Technologies, Inc. stock, with its performance being bolstered by consistent buyer engagement. Key support and resistance zones have been identified, offering strategic entry and exit points. As KEYS continues to hover near resistance levels, a potential breakout might attract further investment. However, traders should remain abreast of market movements to mitigate risks posed by unforeseen dips or resistance rejections.
Smart Data Insight
Master the Perfect Entry & Exit for this Stock
Don't leave your profits to chance. Historically, this stock follows specific seasonal patterns that institutional traders use to maximize returns.
- ✅ Identify the "Golden Buying Window"
- ✅ Avoid high-risk correction cycles
- ✅ Backtested data from the last 20+ years