
June 21, 2026 a 03:43 pm
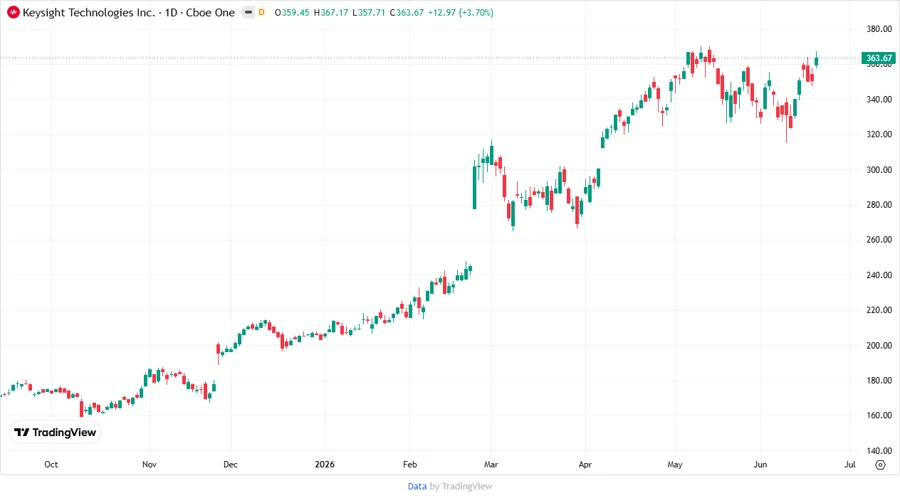
KEYS: Fundamental Ratio Analysis - Keysight Technologies, Inc.
Keysight Technologies, Inc. is a robust player in electronic design and testing solutions, covering an array of global industries. The company's strengths lie in its diverse product range and extensive geographic reach, making it a resilient investment choice. However, market volatility in the tech sector suggests a cautious approach.
Fundamental Rating
The fundamental data presents a solid overall score with particular strengths in Return on Assets. While the Debt to Equity and Valuation ratios indicate room for improvement, the company's position in its industry is commendable.
| Category | Score | Visualization |
|---|---|---|
| Discounted Cash Flow | 3 | |
| Return on Equity | 4 | |
| Return on Assets | 5 | |
| Debt to Equity | 2 | |
| Price to Earnings | 1 | |
| Price to Book | 1 |
Historical Rating
The historical data suggests stability in the company's ratings, with consistent scores over the recent period.
| Date | Overall Score | DCF | ROE | ROA | D/E | P/E | P/B |
|---|---|---|---|---|---|---|---|
| 2026-06-18 | 3 | 3 | 4 | 5 | 2 | 1 | 1 |
| Previous | 0 | 3 | 4 | 5 | 2 | 1 | 1 |
Analyst Price Targets
Analyst estimates indicate a positive outlook with a consensus of 'Buy', reflecting strong growth potential despite market fluctuations.
| High | Low | Median | Consensus |
|---|---|---|---|
| $425 | $350 | $386 | $389.63 |
Analyst Sentiment
The majority of analysts recommend buying this stock, reflecting overall confidence in the company's strategies and future outlook.
| Recommendation | Count | Visualization |
|---|---|---|
| Strong Buy | 0 | |
| Buy | 12 | |
| Hold | 4 | |
| Sell | 0 | |
| Strong Sell | 0 |
Conclusion
Keysight Technologies shows strong potential with solid ratings and positive analyst sentiment. Its diverse industry applications and expansive reach position it well against competitors. However, investors should consider broader tech sector risks. The current debt equity ratios suggest maintaining vigilance, balanced with its overall solid financial metrics.
Smart Data Insight
Master the Perfect Entry & Exit for this Stock
Don't leave your profits to chance. Historically, this stock follows specific seasonal patterns that institutional traders use to maximize returns.
- ✅ Identify the "Golden Buying Window"
- ✅ Avoid high-risk correction cycles
- ✅ Backtested data from the last 20+ years