April 27, 2026 a 04:44 pm

KEYS: Fibonacci Analysis - Keysight Technologies, Inc.
Keysight Technologies (KEYS) has been exhibiting significant price movements in recent months, driven by substantial growth in its core markets such as electronic design and test solutions. Despite some volatility, the company's diverse product portfolio and solid market presence make it a noteworthy consideration for investors interested in the tech sector. Let's delve into a technical analysis using Fibonacci Retracement to uncover potential support and resistance levels for KEYS stock.
Fibonacci Analysis
| Start Date | End Date | High Price | High Date | Low Price | Low Date |
|---|---|---|---|---|---|
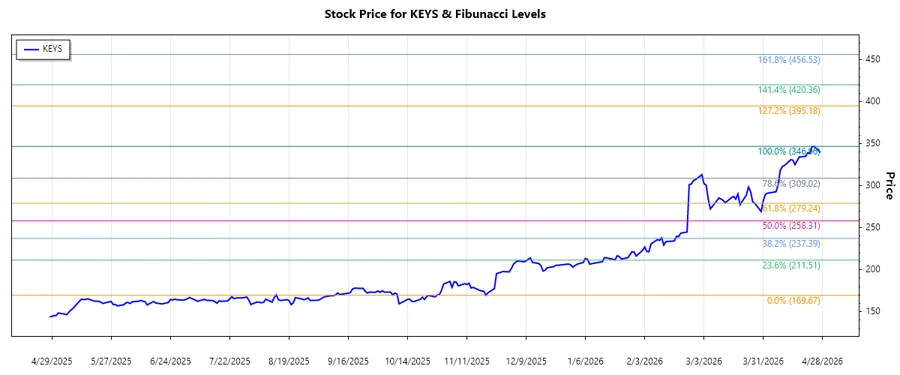
| 2025-11-19 | 2026-04-27 | 346.96 | 2026-04-24 | 169.67 | 2025-11-20 |
| Retracement Level | Price Level |
|---|---|
| 0.236 | 281.39 |
| 0.382 | 256.97 |
| 0.500 | 231.31 |
| 0.618 | 205.65 |
| 0.786 | 180.23 |
The current price of KEYS is at $339.77 and it is above the calculated retracement levels, indicating the stock is trading within a possible new upward trend. The technical interpretation suggests prior retracement levels could serve as future support zones in case of a downward correction.
Conclusion
Keysight Technologies' stock performance over the analysis period shows a strong upward trend from November 2025 to April 2026, indicating robust market support. Investors should be cautious of potential corrections but can view retracement levels as promising entry points. While the current price exceeds several retracement points, suggesting the continuation of this bullish momentum, market participants must remain vigilant for changes in broader market and economic conditions that may impact the stock's trajectory.