September 28, 2025 a 11:44 am
KEYS: Fibonacci Analysis - Keysight Technologies, Inc.
Keysight Technologies, Inc. has exhibited a recent upward trend in its stock price, indicating investor confidence in its diverse offerings in electronic design and test solutions. As the technology sector continues to expand, Keysight is well-positioned to capitalize on growth in the communications and industrial markets. The current analysis uses Fibonacci retracement to identify potential price correction levels for accurate forecasting.
Fibonacci Analysis
| Parameter | Value |
|---|---|
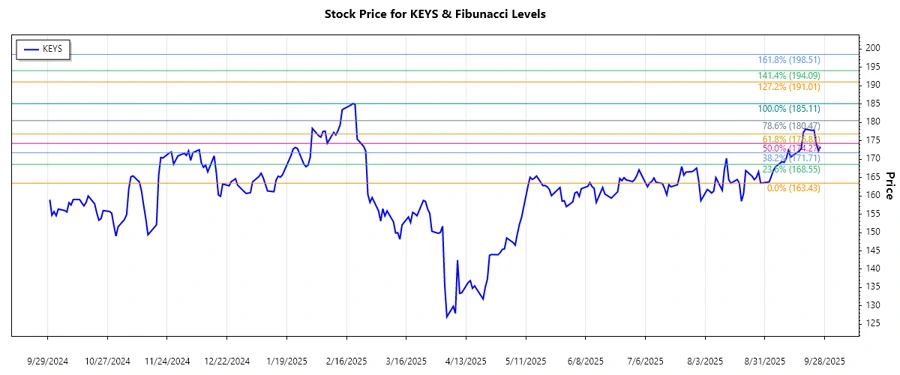
| Trend Start & End Date | February 19, 2025 - September 23, 2025 |
| High Point | $185.11 (February 19, 2025) |
| Low Point | $163.43 (August 29, 2025) |
| 0.236 Fibonacci Level | $168.98 |
| 0.382 Fibonacci Level | $171.77 |
| 0.5 Fibonacci Level | $174.27 |
| 0.618 Fibonacci Level | $176.76 |
| 0.786 Fibonacci Level | $180.14 |
| Current Price Analysis | The current price of $173.34 is within the 0.5 Fibonacci Retracement Zone. |
| Technical Interpretation | The 0.5 retracement suggests a potential support level; violations could imply further downward pressure. |
Conclusion
Keysight Technologies is currently experiencing a moderate price retracement within a dominant upward trend in the stock market. Investors should monitor key support levels as indicated by the Fibonacci analysis to anticipate potential entry or exit points. While the technology sector remains bullish, macroeconomic factors and sector-specific challenges could influence future price volatility. The 0.5 retracement level acts as a significant support point, offering both a buying opportunity if the stock rebounds, or a warning if breached. Analysts should remain vigilant for technical signals alongside fundamental evaluations to make informed investment decisions.
Smart Data Insight
Master the Perfect Entry & Exit for this Stock
Don't leave your profits to chance. Historically, this stock follows specific seasonal patterns that institutional traders use to maximize returns.
- ✅ Identify the "Golden Buying Window"
- ✅ Avoid high-risk correction cycles
- ✅ Backtested data from the last 20+ years