September 06, 2025 a 03:15 pm**KEYS: Fibonacci Analysis - Keysight Technologies, Inc.**
 **Fibonacci Analysis**
 **Conclusion**
Keysight Technologies (Ticker: KEYS) operates in the electronic design and test solutions sector, catering to multiple industries including communications, aerospace, and semiconductors. Having undergone a significant price movement recently, KEYS offers intriguing potential for technical analysis. With the latest data indicating a downward trend, it's essential to evaluate the Fibonacci retracement levels to predict possible future price movements.
Fibonacci Analysis
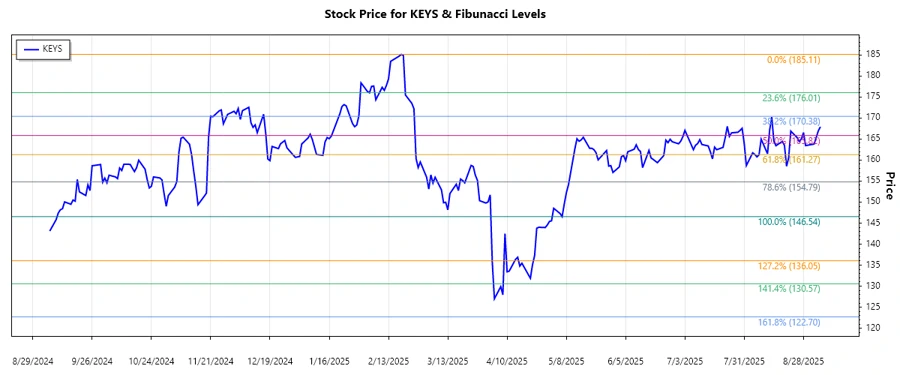
Based on the analyzed historical data, Keysight Technologies has been on a downward trend. We will perform a Fibonacci retracement analysis to predict potential support and resistance levels, which are crucial for decision-making in trading.
| Parameter | Details |
|---|---|
| Trend Start Date | 2025-02-19 |
| Trend End Date | 2025-09-05 |
| High Point | $185.11 on 2025-02-19 |
| Low Point | $146.54 on 2025-05-06 |
Calculated Fibonacci Retracement Levels
| Level | Price |
|---|---|
| 0.236 | $158.87 |
| 0.382 | $164.56 |
| 0.5 | $170.83 |
| 0.618 | $177.09 |
| 0.786 | $184.78 |
The current price as of the last available data (2025-09-05) is $167.9. Presently, the price is hovering near the 0.382 retracement level. This zone can act as a potential resistance point, suggesting a cautious approach for future movements. If this level holds, the market might see a reversal or a consolidation phase.
**Conclusion**
Conclusion
Analyzing the recent price history of Keysight Technologies, Inc., indicates that the stock is currently experiencing a downward trend. The Fibonacci retracement levels have identified potential support and resistance zones crucial for investment decisions. Current positioning near the 0.382 level suggests a potential resistance, which could influence the stock's future price actions. Traders should consider this data when strategizing their approach, as opportunities for growth remain, albeit coupled with apparent risks due to prevailing bearish sentiments. Monitoring market news and economic indicators will give additional context to this technical evaluation.
Smart Data Insight
Master the Perfect Entry & Exit for this Stock
Don't leave your profits to chance. Historically, this stock follows specific seasonal patterns that institutional traders use to maximize returns.
- ✅ Identify the "Golden Buying Window"
- ✅ Avoid high-risk correction cycles
- ✅ Backtested data from the last 20+ years