March 15, 2026 a 08:15 am

KDP: Trend and Support & Resistance Analysis - Keurig Dr Pepper Inc.
Keurig Dr Pepper Inc., a prominent player in the beverage sector, has showcased a diverse portfolio with its Coffee Systems and Packaged Beverages segments. Recent market data indicates potential shifts in its stock trends that are worth analyzing. As investors navigate these insights, understanding technical indicators becomes crucial in making informed decisions regarding this stock's performance.
Trend Analysis
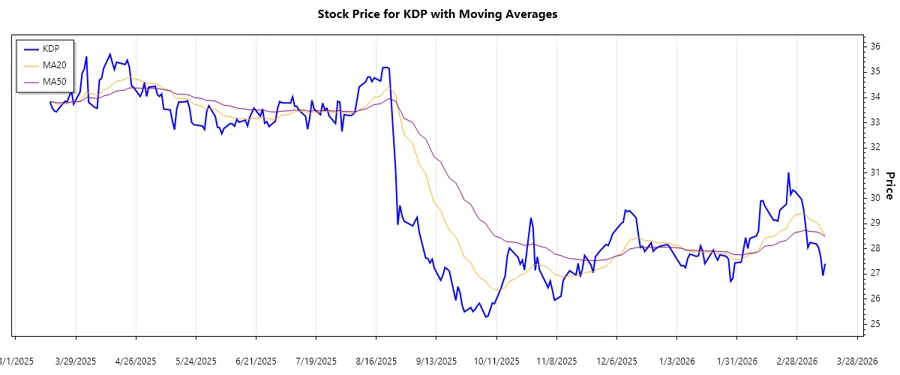
The analysis of Keurig Dr Pepper's stock prices reveals notable trends influenced by recent market conditions. Utilizing the EMA20 and EMA50, a comprehensive understanding of the stock's direction is achieved to guide investment strategies.
| Date | Close Price | Trend |
|---|---|---|
| 2026-03-13 | 27.41 | ▼ |
| 2026-03-12 | 26.93 | ▼ |
| 2026-03-11 | 27.65 | ▼ |
| 2026-03-10 | 28.04 | ▼ |
| 2026-03-09 | 28.19 | ▼ |
| 2026-03-06 | 28.25 | ▼ |
| 2026-03-05 | 28.05 | ▼ |
Interpreting this trend data indicates a bearish outlook, where EMA20 is consistently below EMA50, suggesting downward price movements.
Support and Resistance
Identifying key support and resistance zones within the stock's recent price actions is critical for strategizing market entries and exits.
| Zone Type | From | To |
|---|---|---|
| Support Zone 1 | 25.5 | 26.0 |
| Support Zone 2 | 26.5 | 27.0 |
| Resistance Zone 1 | 29.0 | 29.5 |
| Resistance Zone 2 | 30.0 | 30.5 |
The current stock price is nearing a potential support zone, indicating possible price stabilization or reversal opportunities.
Conclusion
The detailed technical analysis of the KDP stock indicates a recent downward trend, with notable support zones offering potential stabilization points. Investors need to weigh risks associated with price declines against opportunities to buy at support levels. The interaction with these price zones provides a framework for potential price reversals or accelerations, guiding investment decisions grounded in technical insights.