February 02, 2026 a 09:03 am

KDP: Trend and Support & Resistance Analysis - Keurig Dr Pepper Inc.
Keurig Dr Pepper Inc. has shown varied performance in the past months. While coffee systems and packaged beverages remain strong, fluctuations have been evident in the stock due to market conditions. Investors should carefully observe the support and resistance levels for clearer entry and exit strategies. It's essential to analyze the recent trend changes as the company continues to adapt to the evolving consumer landscape.
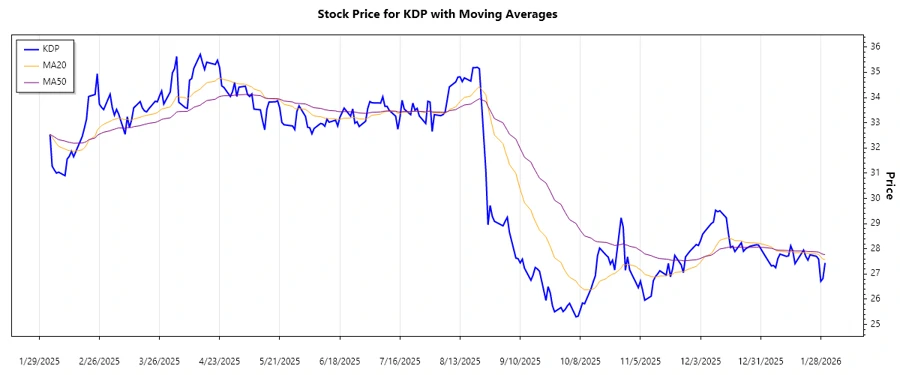
Trend Analysis
Analyzing the daily closing prices, the EMA20 and EMA50 help us identify a trend that indicates a current direction. Based on recent data:
| Date | Close Price | Trend |
|---|---|---|
| 2026-01-30 | $27.44 | ▼ |
| 2026-01-29 | $26.82 | ▼ |
| 2026-01-28 | $26.71 | ▼ |
| 2026-01-27 | $27.59 | ▲ |
| 2026-01-26 | $27.70 | ▲ |
| 2026-01-23 | $27.76 | ▲ |
| 2026-01-22 | $27.55 | ▼ |
The trend shows a mixed outlook with recent signs of bearish movements in the short term. EMA indicators suggest a potential downtrend given the recent price corrections.
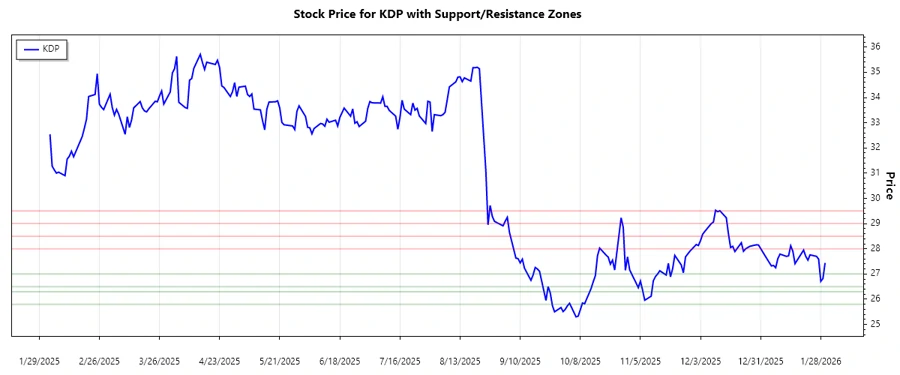
Support and Resistance
Identifying key support and resistance zones helps traders make informed decisions:
| Zone | From | To |
|---|---|---|
| Support | $26.50 | $27.00 |
| Support | $25.80 | $26.30 |
| Resistance | $28.00 | $28.50 |
| Resistance | $29.00 | $29.50 |
Currently, the stock price appears to be testing the support zone. If this level holds, it could signal a potential buying opportunity; otherwise, further declines may test the lower support levels.
Conclusion
Keurig Dr Pepper Inc.'s stock displays a nuanced market movement impacted by recent trends and key price zones. The current trend indicators suggest caution as the stock tests its support areas. Nevertheless, the company's strong market positioning and diversification could appeal to long-term investors. Traders may find opportunities in short-term price fluctuations, especially if support holds or if there's a breakout past the resistance zones. The strategic analysis of these levels is essential for optimizing investment decisions.