September 30, 2025 a 09:04 am
KDP: Trend and Support & Resistance Analysis - Keurig Dr Pepper Inc.
Keurig Dr Pepper Inc. shares have shown recent volatility, reflecting a complex market environment. The stock has experienced fluctuations, indicating investor uncertainty and market reactions to broader economic factors. Technical analysis reveals decisive patterns in its movement, providing insights into potential future trends. Investors must remain informed of sector dynamics to react appropriately to market shifts.
Trend Analysis
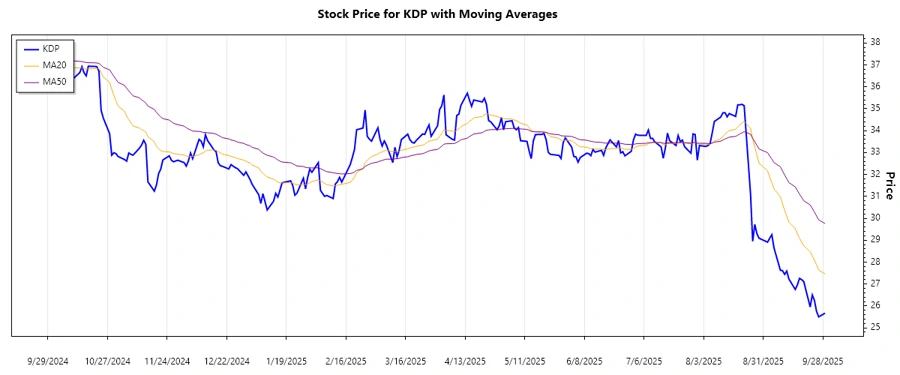
The analysis of KDP stock based on EMA indicators shows a significant trend direction. Calculating the 20-day EMA and 50-day EMA on recent data helps identify the current trend pattern.
| Date | Close Price | Trend |
|---|---|---|
| 2025-09-29 | 25.67 | ▼ |
| 2025-09-26 | 25.50 | ▼ |
| 2025-09-25 | 25.75 | ▼ |
| 2025-09-24 | 26.25 | ▼ |
| 2025-09-23 | 26.50 | ▼ |
| 2025-09-22 | 25.95 | ▼ |
| 2025-09-19 | 27.11 | ▲ |
With the EMA20 being below EMA50, there is a downward trend in the market. This typically suggests bearish sentiment and potential further decline in prices.
Support and Resistance
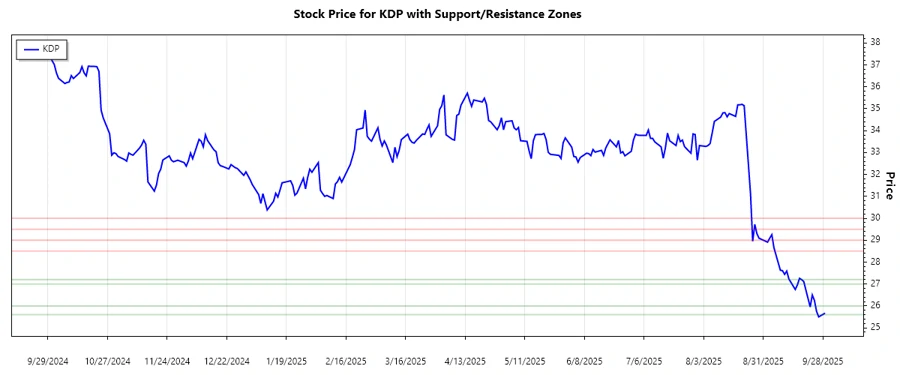
Analysis of KDP’s recent price movements identifies key support and resistance zones. These levels are crucial for determining potential price actions.
| Zone Type | From | To |
|---|---|---|
| Support Zone 1 | 25.60 | 26.00 |
| Support Zone 2 | 27.00 | 27.20 |
| Resistance Zone 1 | 28.50 | 29.00 |
| Resistance Zone 2 | 29.50 | 30.00 |
Currently, the stock price is near the lower support levels, indicating potential for a rebound. However, breaking below could signal further downward momentum.
Conclusion
Keurig Dr Pepper Inc. is facing a bearish trend with the potential for further downside, but key support zones may act as reversal points. Traders should watch these levels closely. Despite current pressures, the beverage sector could see positive shifts due to upcoming product innovations and market adjustments. Strategic positions could yield benefits as the market corrects itself over time.
Smart Data Insight
Master the Perfect Entry & Exit for this Stock
Don't leave your profits to chance. Historically, this stock follows specific seasonal patterns that institutional traders use to maximize returns.
- ✅ Identify the "Golden Buying Window"
- ✅ Avoid high-risk correction cycles
- ✅ Backtested data from the last 20+ years