October 29, 2025 a 06:44 am
KDP: Fibonacci Analysis - Keurig Dr Pepper Inc.
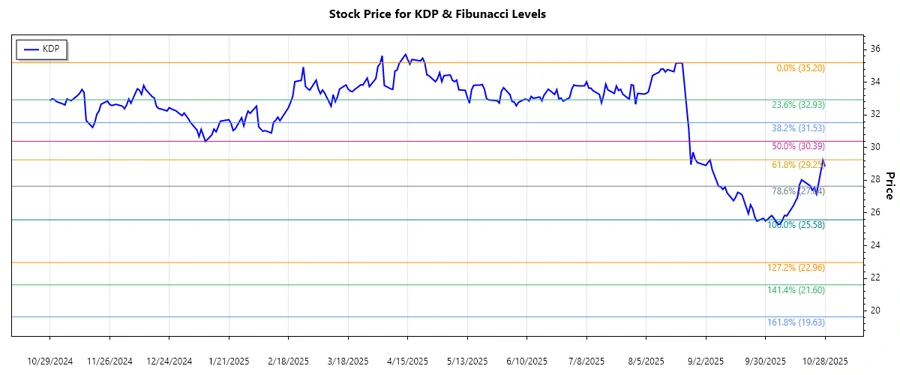
Keurig Dr Pepper Inc. (KDP) has shown a clear downward trend over the past few months, reflecting broader market conditions and internal business dynamics. As a major player in the beverage industry, KDP's diverse product offerings remain strong, but recent market fluctuations have influenced its stock performance. The current analysis, focusing on recent price data, suggests attention to key support and resistance levels via a Fibonacci retracement study.
Fibonacci Analysis
The analysis focuses on the downtrend observed from the high in August to the recent lows in October 2025. Calculating Fibonacci retracement levels provides insight into potential support and resistance areas.
| Information | Details |
|---|---|
| Trend Start Date | 2025-08-21 |
| Trend End Date | 2025-10-28 |
| High | $35.20 (2025-08-21) |
| Low | $25.58 (2025-10-08) |
| Fibonacci Level 0.236 | $28.15 |
| Fibonacci Level 0.382 | $29.31 |
| Fibonacci Level 0.5 | $30.39 |
| Fibonacci Level 0.618 | $31.47 |
| Fibonacci Level 0.786 | $32.88 |
| Current Price | $28.85 |
| Retracement Zone | None |
| Interpretation | The current price is slightly above the 0.236 level, signifying potential upward correction. However, it remains below larger pivotal retracement levels, indicating weaker bullish momentum. |
Conclusion
In summary, Keurig Dr Pepper Inc.'s recent stock performance illustrates a recovery attempt amidst a prevailing downtrend. While the Fibonacci analysis shows resistance likely at multiple levels, the stock needs to consistently close above the 0.236 Fibonacci retracement level to suggest further bullish momentum. Investors should be cautious, considering potential support at the $25.58 low. Long-term positions might be calibrated by monitoring these Fibonacci levels as significant technical indicators. Analysts should note that external factors, including market trends and company developments, will also impact KDP's stock movement.
Smart Data Insight
Master the Perfect Entry & Exit for this Stock
Don't leave your profits to chance. Historically, this stock follows specific seasonal patterns that institutional traders use to maximize returns.
- ✅ Identify the "Golden Buying Window"
- ✅ Avoid high-risk correction cycles
- ✅ Backtested data from the last 20+ years