October 19, 2025 a 05:15 am

KDP: Fibonacci Analysis - Keurig Dr Pepper Inc.
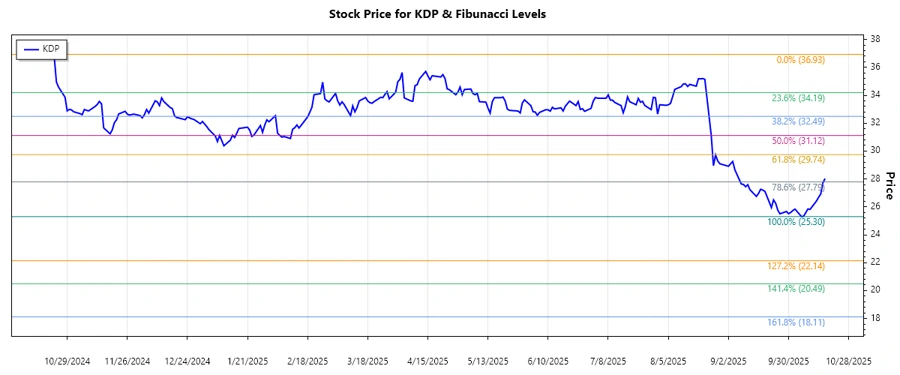
The stock of Keurig Dr Pepper Inc. (KDP) has shown a distinct bearish trend over the past months. The company operates in various beverage segments, providing a vast portfolio of products both domestically and internationally. Recent market behavior has shown a downturn, presenting potential challenges and opportunities for traders and investors depending on market positioning and sentiment. A comprehensive Fibonacci retracement analysis can help identify key levels to watch as the price actions unfold.
Fibonacci Analysis
| Criteria | Details |
|---|---|
| Trend Type | Downtrend |
| Start Date | 2024-10-21 |
| End Date | 2025-10-17 |
| High Point (Price & Date) | $36.93 on 2024-10-21 |
| Low Point (Price & Date) | $25.3 on 2025-10-06 |
| Fibonacci Levels |
|
| Current Price | $28.03 |
| Retracement Zone | Below 0.236 |
| Interpretation | The current price is below the 0.236 Fibonacci retracement level, indicating a strong bearish sentiment. It might suggest limited immediate support until reaching the low point, offering potential downside risk unless bullish momentum re-emerges. |
Conclusion
In conclusion, Keurig Dr Pepper Inc.'s stock has been in a persistent downtrend recently. The Fibonacci analysis indicates limited support levels in the immediate price range, suggesting strong bearish sentiment. However, should the stock find a foothold around its previous low or a new catalyst emerges, it could provide an attractive entry point for long positions. Investors should remain vigilant for any changes in market conditions or fundamental news that could impact the current trajectory.
Smart Data Insight
Master the Perfect Entry & Exit for this Stock
Don't leave your profits to chance. Historically, this stock follows specific seasonal patterns that institutional traders use to maximize returns.
- ✅ Identify the "Golden Buying Window"
- ✅ Avoid high-risk correction cycles
- ✅ Backtested data from the last 20+ years