
May 13, 2026 a 11:31 am

KDP: Dividend Analysis - Keurig Dr Pepper Inc.
Keurig Dr Pepper Inc. presents a robust dividend profile, showcasing a dividend yield that stands out in its sector. With a maintained continuity in dividend payments for 18 years, the firm's maturity in managing shareholder returns is evident. This analysis aims to dive deeper into different aspects of the company's dividend and financial health metrics.
📊 Overview
Keurig Dr Pepper operates within the Consumer Beverages sector, offering shareholders an appealing dividend yield. The consistency in dividends, without any cuts or suspensions, over the past 18 years suggests reliability and financial discipline.
| Criteria | Details |
|---|---|
| Sector | Consumer Beverages |
| Dividend Yield | 3.51% |
| Current Dividend per Share | 0.92 USD |
| Dividend History | 18 years |
| Last Cut or Suspension | None |
📈 Dividend History
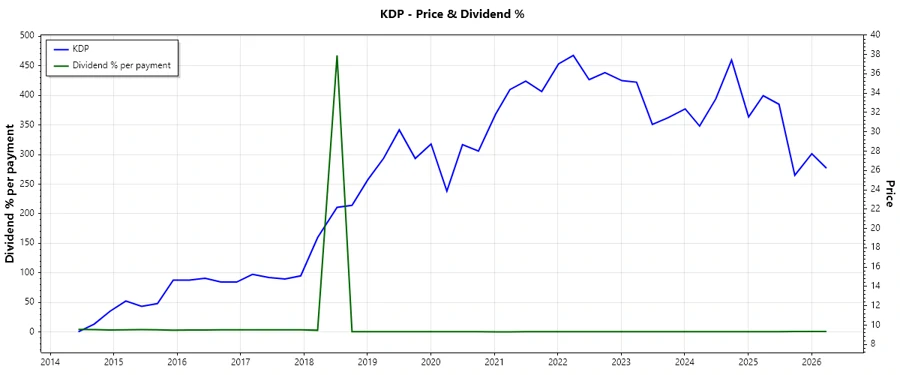
The dividend history of Keurig Dr Pepper is a testament to its commitment to returning capital to shareholders. This track record reflects stability and trust in an industry where consistency is valued by investors.
| Year | Dividend per Share (USD) |
|---|---|
| 2026 | 0.46 |
| 2025 | 0.92 |
| 2024 | 0.875 |
| 2023 | 0.815 |
| 2022 | 0.7625 |
📈 Dividend Growth
Dividend growth is an essential indicator of a company's capacity to enhance shareholder value over time. The growth rates over three and five years imply a diligent escalation in the dividends, demonstrating the company's commitment to shareholder returns.
| Time | Growth |
|---|---|
| 3 years | 6.46% |
| 5 years | 8.92% |
The average dividend growth is 8.92% over 5 years. This shows moderate but steady dividend growth.
📈 Payout Ratio
The payout ratio is crucial in evaluating how much of the company earnings are paid back to shareholders in dividends. Keurig Dr Pepper's EPS payout ratio and FCF payout ratio provide insight into the sustainability of its dividend policy.
| Key Figure | Ratio |
|---|---|
| EPS-based | 68.29% |
| Free cash flow-based | 79.21% |
The payout ratios suggest a comfortable coverage, with the dividends being well-supported by earnings and cash flows, although the high FCF payout may imply a tighter cash flow under pressure.
📊 Cashflow & Capital Efficiency
Analyzing cash flow alongside capital efficiency provides insights into the operational robustness of the company which supports its dividend capability.
| Metric | 2023 | 2024 | 2025 |
|---|---|---|---|
| Free Cash Flow Yield | 1.82% | 3.78% | 3.96% |
| Earnings Yield | 4.68% | 3.29% | 5.47% |
| CAPEX to Operating Cash Flow | 36.19% | 25.37% | 24.41% |
| Stock-based compensation to Revenue | 0.78% | 0.64% | 0.58% |
| Free Cash Flow / Operating Cash Flow Ratio | 63.81% | 74.63% | 75.59% |
The cash flow figures reflect a stable and efficient capital management strategy, showcasing the firm's ability to convert operational cash flow effectively into free cash flow, crucial for sustaining future dividends.
📊 Balance Sheet & Leverage Analysis
Balance sheet metrics offer insights into the financial structure and resilience of the company, key elements in understanding dividend sustainability.
| Metric | 2023 | 2024 | 2025 |
|---|---|---|---|
| Debt-to-Equity | 0.58 | 0.71 | 0.63 |
| Debt-to-Assets | 0.28 | 0.32 | 0.29 |
| Debt-to-Capital | 0.37 | 0.42 | 0.39 |
| Net Debt to EBITDA | 3.66 | 4.96 | 3.60 |
| Current Ratio | 0.38 | 0.49 | 0.64 |
| Quick Ratio | 0.25 | 0.33 | 0.43 |
| Financial Leverage | 2.03 | 2.20 | 2.17 |
Despite leverage increments, Keurig Dr Pepper shows improving ratios, indicating bolstered financial strength and liquidity to weather economic shifts while maintaining its dividend payouts.
📊 Fundamental Strength & Profitability
Fundamental metrics are assessed to capture the profitability and operational efficiency of the company, essential for sustaining a continuous dividend yield.
| Metric | 2023 | 2024 | 2025 |
|---|---|---|---|
| Return on Equity | 8.49% | 5.94% | 8.15% |
| Return on Assets | 4.18% | 2.70% | 3.75% |
| Margins: Net | 14.72% | 9.39% | 12.52% |
| EBIT | 21.96% | 17.25% | 20.73% |
| EBITDA | 26.82% | 22.03% | 25.26% |
| Gross | 54.54% | 55.56% | 52.41% |
| Research & Development to Revenue | 0.00% | 0.00% | 0.00% |
The company's profitability margins underscore strong operational performance and robust fundamentals that support its dividend strategy over the long term.
📈 Price Development
✅ Dividend Scoring System
| Criteria | Score (1-5) | Score Bar |
|---|---|---|
| Dividend Yield | 4 | |
| Dividend Stability | 5 | |
| Dividend Growth | 4 | |
| Payout Ratio | 3 | |
| Financial Stability | 4 | |
| Dividend Continuity | 5 | |
| Cashflow Coverage | 3 | |
| Balance Sheet Quality | 4 |
Overall Score: 32/40
🗣️ Rating
Keurig Dr Pepper Inc. exhibits a strong dividend payout capacity backed by reliable growth and sound financials. The company earns a favorable overall rating in our dividend scoring system, making it an attractive choice for dividend-focused investors. The sturdy continuity of payments, alongside prudent financial management, positions it well in the market, despite certain leverage and cash flow coverage challenges.
Smart Data Insight
Master the Perfect Entry & Exit for this Stock
Don't leave your profits to chance. Historically, this stock follows specific seasonal patterns that institutional traders use to maximize returns.
- ✅ Identify the "Golden Buying Window"
- ✅ Avoid high-risk correction cycles
- ✅ Backtested data from the last 20+ years