December 03, 2025 a 11:31 am


KDP: Dividend Analysis - Keurig Dr Pepper Inc.
Keurig Dr Pepper Inc., with its robust dividend history and consistent growth, represents a stable investment opportunity in the beverage and home beverage system sectors. Despite a high payout ratio, the company's steady dividend increase suggests enduring financial strength. The company's complex capital structure and EPS payout ratio highlight its commitment to returning value to shareholders amidst market volatility.
📊 Overview
The overview provides a snapshot of key dividend markers, offering insights into the sector's performance and payout consistency.
| Detail | Value |
|---|---|
| Sector | Beverages |
| Dividend Yield | 3.61% |
| Current Dividend per Share | 0.88 USD |
| Dividend History | 17 years |
| Last Cut or Suspension | 2019 |
📈 Dividend History
Assessing dividend history sheds light on the company's past performance and reliability in dividends distribution. The historical data confirms consistent growth even through economic turbulence.
| Year | Dividend per Share (USD) |
|---|---|
| 2025 | 0.92 |
| 2024 | 0.875 |
| 2023 | 0.815 |
| 2022 | 0.7625 |
| 2021 | 0.675 |
📈 Dividend Growth
Evaluating the pace at which dividends grow is crucial for understanding future payout potential and financial health sustainability. Moderate growth reflects balanced financial management.
| Time | Growth |
|---|---|
| 3 years | 9.04% |
| 5 years | 7.84% |
The average dividend growth is 7.84% over 5 years. This shows moderate but steady dividend growth.
📈 Payout Ratio
Payout ratios are key indicators of dividend sustainability. The balance between EPS and free cash flow-based ratios reveals the company's commitment to its dividend policy.
| Key Figure | Ratio |
|---|---|
| EPS-based | 75.27% |
| Free cash flow-based | 73.83% |
The EPS payout ratio of 75.27% suggests a high portion of earnings being returned to shareholders, while a free cash flow payout of 73.83% indicates good financial health enabling these payouts.
📊 Cashflow & Capital Efficiency
Cashflow metrics, combined with capital efficiency ratios, provide insights into the operations' effectiveness and financial management.
| Year | 2024 | 2023 | 2022 |
|---|---|---|---|
| Free Cash Flow Yield | 3.78% | 1.82% | 4.87% |
| Earnings Yield | 3.29% | 4.68% | 2.84% |
| CAPEX to Operating Cash Flow | 24.20% | 36.19% | 13.36% |
| Stock-based Compensation to Revenue | 0.64% | 0.78% | 0.37% |
| Free Cash Flow / Operating Cash Flow Ratio | 74.63% | 63.81% | 86.64% |
The cash flow metrics underline KDP's efficient capital usage and stable cash generation, critical for long-term investment stability.
📊 Balance Sheet & Leverage Analysis
An in-depth analysis of leverage and liquidity ratios provides a window into the company's financial resilience and flexibility.
| Year | 2024 | 2023 | 2022 |
|---|---|---|---|
| Debt-to-Equity | 0.71 | 0.58 | 0.54 |
| Debt-to-Assets | 0.32 | 0.28 | 0.26 |
| Debt-to-Capital | 0.42 | 0.37 | 0.35 |
| Net Debt to EBITDA | 4.96 | 3.66 | 4.18 |
| Current Ratio | 0.49 | 0.38 | 0.47 |
| Quick Ratio | 0.33 | 0.25 | 0.31 |
| Financial Leverage | 2.20 | 2.03 | 2.06 |
The debt structure indicates moderate leverage, which combined with solid liquidity ratios, attests to KDP's capability to meet its financial obligations adequately.
📊 Fundamental Strength & Profitability
Reviewing profitability metrics and margins highlights the company’s operational efficiency and profitability potential.
| Year | 2024 | 2023 | 2022 |
|---|---|---|---|
| Return on Equity | 5.94% | 8.49% | 5.72% |
| Return on Assets | 2.70% | 4.18% | 2.77% |
| Net Margin | 9.39% | 14.72% | 10.22% |
| EBIT Margin | 17.26% | 21.96% | 17.16% |
| EBITDA Margin | 22.03% | 26.82% | 22.20% |
| Gross Margin | 55.56% | 54.54% | 52.10% |
| R&D to Revenue | 0% | 0% | 0% |
The wide profit margins and stable returns on equity and assets reinforce KDP's operational effectiveness and profitability.
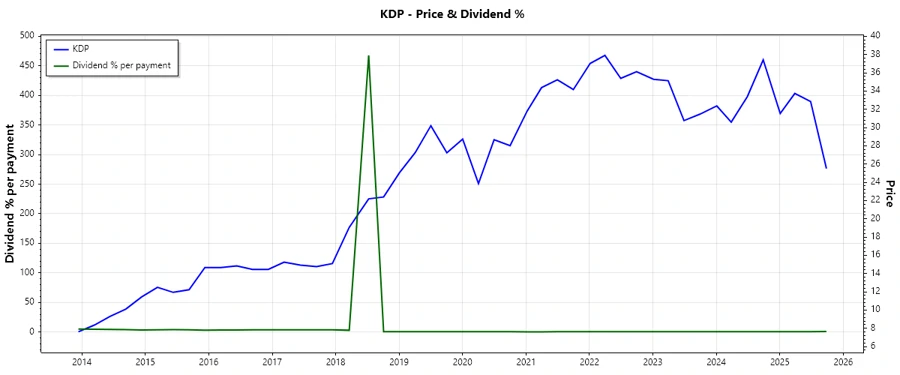
📉 Price Development
🗣️ Dividend Scoring System
| Category | Rating (out of 5) | Score Bar |
|---|---|---|
| Dividend Yield | 4 | |
| Dividend Stability | 5 | |
| Dividend Growth | 3 | |
| Payout Ratio | 4 | |
| Financial Stability | 4 | |
| Dividend Continuity | 5 | |
| Cashflow Coverage | 4 | |
| Balance Sheet Quality | 4 |
Overall Score: 33/40
✅ Rating
In conclusion, with its strong dividend history and moderate growth, Keurig Dr Pepper Inc. offers a compelling investment opportunity for dividend income seekers. The high dividend stability and overall financial health make it a potential candidate for a balanced portfolio aiming for steady returns, even amidst economic uncertainty.