September 11, 2025 a 03:32 am


KDP: Dividend Analysis - Keurig Dr Pepper Inc.
Keurig Dr Pepper Inc. presents a moderate dividend yield with a steady history of distribution over 17 consecutive years. While there are moderate growth rates in dividends, the company's payout ratios should be closely monitored, suggesting a balanced but cautious approach to dividend sustainability.
📊 Overview
The overview of Keurig Dr Pepper Inc.'s dividend metrics shows a reliable company operating within the beverage sector. With a dividend yield of 2.80% and a current dividend per share of 0.88 USD, the company upholds a consistent dividend history of 17 years without recent cuts or suspensions.
| Metric | Value |
|---|---|
| Sector | Beverages |
| Dividend yield | 2.80% |
| Current dividend per share | 0.88 USD |
| Dividend history | 17 years |
| Last cut or suspension | None |
📈 Dividend History
The dividend history is crucial as it indicates how committed a company is to returning value to its shareholders. Keurig Dr Pepper has consistently paid dividends, even increasing the payouts over the years, reflecting its financial health and operational success.
| Year | Dividend per Share (USD) |
|---|---|
| 2025 | 0.69 |
| 2024 | 0.875 |
| 2023 | 0.815 |
| 2022 | 0.7625 |
| 2021 | 0.6750 |
🚀 Dividend Growth
Dividend growth is a vital metric for understanding a company's ability to increase shareholder returns over time. Keurig Dr Pepper's 3-year growth rate of 9.04% and a 5-year growth rate of 7.84% demonstrate a moderate but consistent increase in dividend payouts.
| Time | Growth |
|---|---|
| 3 years | 9.04% |
| 5 years | 7.84% |
The average dividend growth is 7.84% over 5 years. This shows moderate but steady dividend growth, reflecting management's confidence in the company's earnings capability.
🗣️ Payout Ratio
Payout ratios provide insights into how much of the earnings are distributed as dividends, indicating sustainability. Keurig Dr Pepper's EPS payout ratio of 77.51% and FCF payout ratio of 74.93% are on the higher side, signaling potential concerns if earnings were to decline.
| Key figure | Ratio |
|---|---|
| EPS-based | 77.51% |
| Free cash flow-based | 74.93% |
The high payout ratios suggest that most of the profits are being returned to shareholders, which can be advantageous in stable economic conditions but could limit growth prospects.
💼 Cashflow & Capital Efficiency
The efficiency in generating and using cash flows highlights operational stability and capital allocation strategies. Keurig Dr Pepper demonstrates strong cash generation capabilities, but the CAPEX to Operating Cash Flow ratio illustrates balanced reinvestment strategies essential for sustained growth.
| Metric | 2022 | 2023 | 2024 |
|---|---|---|---|
| Free Cash Flow Yield | 4.87% | 1.82% | 3.78% |
| Earnings Yield | 2.84% | 4.68% | 3.29% |
| CAPEX to Operating Cash Flow | 13.36% | 36.19% | 25.37% |
| Stock-based Compensation to Revenue | 0.37% | 0.78% | 0.64% |
| Free Cash Flow / Operating Cash Flow Ratio | 86.64% | 63.81% | 74.63% |
The company's efficient cashflow management coupled with strong capital efficiency metrics underpins its ability to sustain dividends and invest for future growth.
📉 Balance Sheet & Leverage Analysis
The balance sheet strength and leverage are pivotal for sustaining operations and dividends especially under economic strain. Keurig Dr Pepper holds adequate liquidity ratios, though the leverage ratios suggest reliance on debt could impact long-term flexibility.
| Metric | 2022 | 2023 | 2024 |
|---|---|---|---|
| Debt-to-Equity | 0.541 | 0.577 | 0.713 |
| Debt-to-Assets | 0.262 | 0.284 | 0.323 |
| Debt-to-Capital | 0.351 | 0.366 | 0.416 |
| Net Debt to EBITDA | 4.51 | 3.57 | 5.03 |
| Current Ratio | 0.471 | 0.379 | 0.637 |
| Quick Ratio | 0.308 | 0.250 | 0.334 |
| Financial Leverage | 2.063 | 2.030 | 2.204 |
The financial leverage and debt metrics suggest a well-managed balance sheet, although increased vigilance is needed to prevent excessive leverage.
🏦 Fundamental Strength & Profitability
Examining fundamental strength and profitability indicators like ROE and margins are vital to assessing long-term viability. Keurig Dr Pepper maintains solid profitability margins, with ROE and ROIC reflecting competent management and robust operational execution.
| Metric | 2022 | 2023 | 2024 |
|---|---|---|---|
| Return on Equity | 5.72% | 8.49% | 5.94% |
| Return on Assets | 2.77% | 4.18% | 2.70% |
| Net Margin | 10.22% | 14.72% | 9.39% |
| EBIT Margin | 15.56% | 22.63% | 16.92% |
| EBITDA Margin | 20.60% | 27.49% | 21.70% |
| Gross Margin | 48.82% | 51.38% | 52.15% |
| R&D to Revenue | 0.46% | 0.45% | 0.46% |
The maintained healthy profitability ratios reflect the company's effective cost management and solid market positioning.
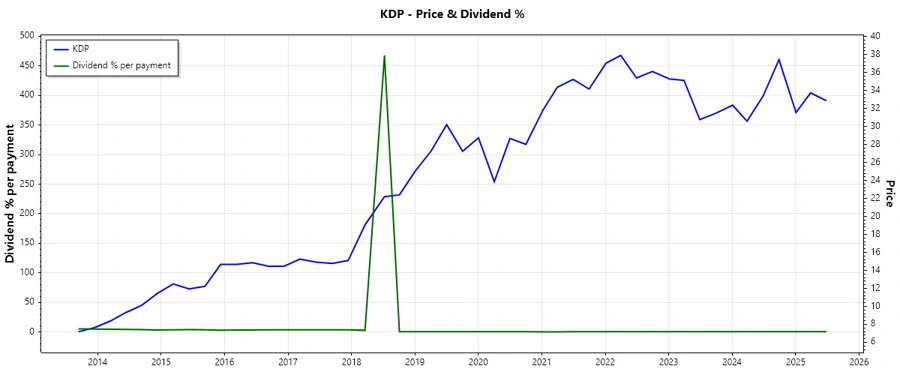
📈 Price Development
🔍 Dividend Scoring System
| Criteria | Score | Rating |
|---|---|---|
| Dividend yield | 4 | |
| Dividend Stability | 5 | |
| Dividend growth | 3 | |
| Payout ratio | 2 | |
| Financial stability | 3 | |
| Dividend continuity | 5 | |
| Cashflow Coverage | 4 | |
| Balance Sheet Quality | 3 |
Overall Score: 29/40
✅ Rating
Keurig Dr Pepper Inc. maintains a commendable track record for dividends, showing moderate growth and consistency. However, high payout ratios necessitate caution regarding future dividend sustainability. The company's balance sheet and cash flow analysis strongly support continued shareholder returns, suggesting it is a viable consideration for dividend-focused portfolios.
Smart Data Insight
Master the Perfect Entry & Exit for this Stock
Don't leave your profits to chance. Historically, this stock follows specific seasonal patterns that institutional traders use to maximize returns.
- ✅ Identify the "Golden Buying Window"
- ✅ Avoid high-risk correction cycles
- ✅ Backtested data from the last 20+ years