June 02, 2025 a 03:31 pm

KDP: Dividend Analysis - Keurig Dr Pepper Inc.
Keurig Dr Pepper Inc. has demonstrated a solid commitment to delivering shareholder value through its dividend policy. With a dividend yield of 2.73%, steady growth over the past few years, and a 17-year history without any recent cuts, KDP shows resilience and reliability. However, the high payout ratios indicate that the company is distributing a significant portion of its earnings as dividends, which could limit flexibility for future growth investments.
📊 Overview
The overview section provides core insights into the company's dividend performance and sector alignment.
| Metric | Value |
|---|---|
| Sector | Beverages |
| Dividend yield | 2.73% |
| Current dividend per share | $0.88 |
| Dividend history | 17 years |
| Last cut or suspension | None |
🗣️ Dividend History
A strong dividend history reflects the company's commitment to providing consistent returns to its shareholders. This history is crucial for investors seeking stable income.
| Year | Dividend per Share (USD) |
|---|---|
| 2025 | $0.69 |
| 2024 | $0.875 |
| 2023 | $0.815 |
| 2022 | $0.7625 |
| 2021 | $0.6750 |
📈 Dividend Growth
Growth in dividend payments indicates a company's strong ability to generate excess cash and its willingness to share profits with shareholders.
| Time | Growth |
|---|---|
| 3 years | 9.04% |
| 5 years | 7.84% |
The average dividend growth is 7.84% over 5 years. This shows moderate but steady dividend growth.
📉 Payout Ratio
Payout ratios offer insight into how much of a company's earnings are returned to shareholders as dividends. High ratios can indicate risk if not supported by earnings growth.
| Key figure | Ratio |
|---|---|
| EPS-based | 79.09% |
| Free cash flow-based | 66.51% |
The EPS payout ratio of 79.09% and FCF payout ratio of 66.51% suggest that the company returns a substantial amount of its earnings to shareholders. This can be a double-edged sword: attractive to income investors but potentially limiting for reinvestment into the business.
✅ Cashflow & Capital Efficiency
Understanding cash flow performance alongside capital efficiency metrics is crucial for assessing the sustainability of dividends and overall financial health.
| Metric | 2024 | 2023 | 2022 |
|---|---|---|---|
| Free Cash Flow Yield | 3.78% | 1.82% | 4.87% |
| Earnings Yield | 3.29% | 4.68% | 2.84% |
| CAPEX to Operating Cash Flow | 23.60% | 36.19% | 13.36% |
| Stock-based Compensation to Revenue | 0.64% | 0.78% | 0.37% |
| Free Cash Flow / Operating Cash Flow Ratio | 74.63% | 63.81% | 86.64% |
The data reflects steady capital returns, though a high CAPEX/OCF in recent years might indicate substantial investments which require a closer evaluation of return on these investments.
⚠️ Balance Sheet & Leverage Analysis
A robust balance sheet with manageable debt levels is vital to ensure a company's ability to support dividends in the long term.
| Metric | 2024 | 2023 | 2022 |
|---|---|---|---|
| Debt-to-Equity | 0.71 | 0.58 | 0.48 |
| Debt-to-Assets | 0.32 | 0.28 | 0.23 |
| Debt-to-Capital | 0.42 | 0.37 | 0.32 |
| Net Debt to EBITDA | 5.03 | 3.66 | 3.19 |
| Current Ratio | 0.49 | 0.38 | 0.47 |
| Quick Ratio | 0.33 | 0.25 | 0.31 |
Despite increasing leverage, the financial structure remains disciplined, suggesting adequate control over liabilities and potential flexibility in managing overall solvency.
✅ Fundamental Strength & Profitability
The company's profitability metrics highlight its ability to generate earnings relative to sales, assets, and equity, which ultimately influence dividend potential.
| Metric | 2024 | 2023 | 2022 |
|---|---|---|---|
| Return on Equity | 5.94% | 8.49% | 5.72% |
| Return on Assets | 2.70% | 4.18% | 2.77% |
| Net Margin | 9.39% | 14.72% | 10.22% |
| EBIT Margin | 17.26% | 21.96% | 17.16% |
| EBITDA Margin | 21.70% | 26.82% | 25.49% |
Strong profitability measures indicate robust operational performance that supports sustained dividend payments.
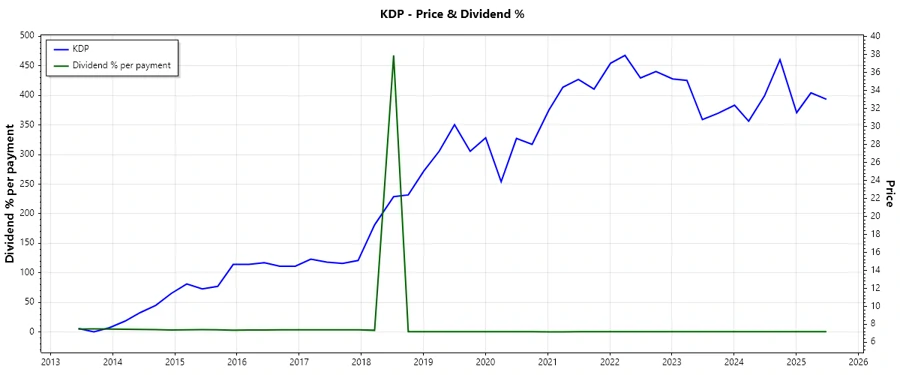
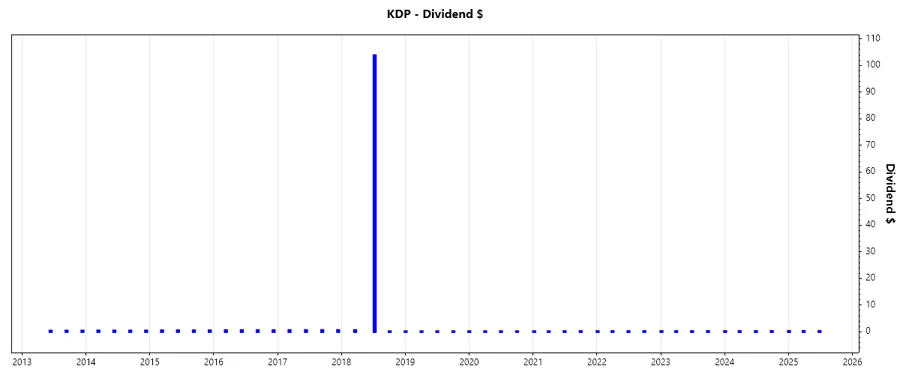
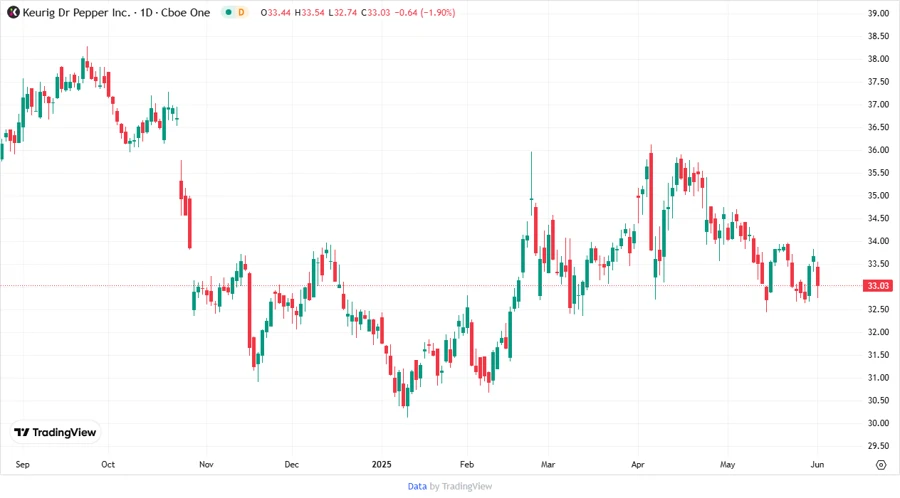
📈 Price Development
✅ Dividend Scoring System
The dividend scoring system provides a quantified assessment of the company's dividend reliability and growth potential.
| Criteria | Score | Bar |
|---|---|---|
| Dividend yield | 4 | |
| Dividend stability | 5 | |
| Dividend growth | 3 | |
| Payout ratio | 3 | |
| Financial stability | 3 | |
| Dividend continuity | 5 | |
| Cashflow Coverage | 4 | |
| Balance Sheet Quality | 3 |
Overall Score: 30/40
🗣️ Rating
Keurig Dr Pepper Inc. presents itself as an attractive dividend investment for those seeking moderate growth combined with a high degree of stability. However, potential investors should be cautious about the elevated payout ratios that may signal limited flexibility to increase dividends further in the short-term unless supported by substantial earnings growth. Overall, it stands as a reliable but cautiously optimistic choice in a balanced dividend portfolio.
Smart Data Insight
Master the Perfect Entry & Exit for this Stock
Don't leave your profits to chance. Historically, this stock follows specific seasonal patterns that institutional traders use to maximize returns.
- ✅ Identify the "Golden Buying Window"
- ✅ Avoid high-risk correction cycles
- ✅ Backtested data from the last 20+ years