June 15, 2026 a 11:43 am

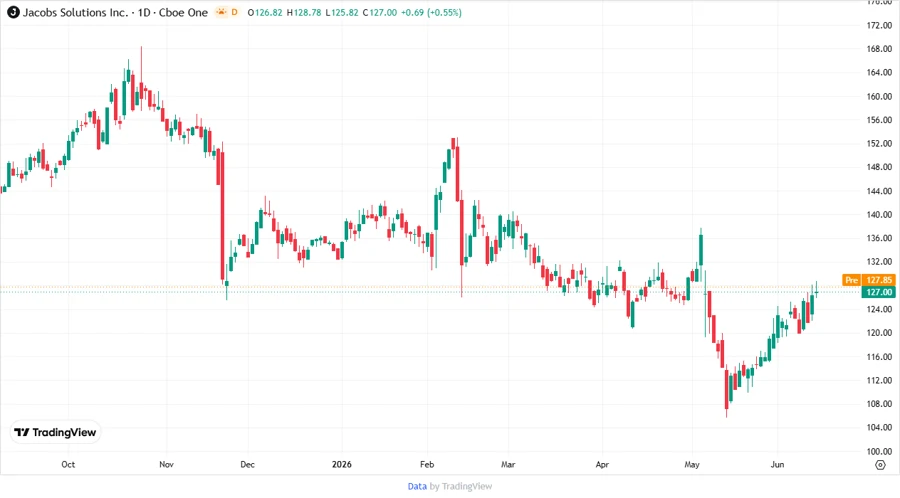
J: Fundamental Ratio Analysis - Jacobs Solutions Inc.
Jacobs Solutions Inc. is well-positioned in the infrastructure and consulting industry. The stock shows moderate potential for growth, with its strong presence in multiple regions and sectors. However, investors should consider industry fluctuations and market conditions.
Fundamental Rating
Jacobs Solutions Inc. has a solid fundamental rating, signifying good financial health and potential for sustainable growth.
| Category | Score | Visual Representation |
|---|---|---|
| Discounted Cash Flow | 3 | |
| Return on Equity | 4 | |
| Return on Assets | 4 | |
| Debt to Equity | 1 | |
| Price to Earnings | 2 | |
| Price to Book | 2 |
Historical Rating
The historical ratings reflect stability in the company's key financial metrics.
| Date | Overall | DCF | ROE | ROA | D/E | P/E | P/B |
|---|---|---|---|---|---|---|---|
| 2026-06-12 | 3 | 3 | 4 | 4 | 1 | 2 | 2 |
| Previous | 0 | 3 | 4 | 4 | 1 | 2 | 2 |
Analyst Price Targets
Analysts suggest a Buy rating, with considerable confidence in upward momentum.
| High | Low | Median | Consensus |
|---|---|---|---|
| $175 | $137 | $163 | $157.14 |
Analyst Sentiment
The sentiment among analysts is predominantly positive, favoring a moderate Buy.
| Recommendation | Count | Visual Representation |
|---|---|---|
| Strong Buy | 0 | |
| Buy | 24 | |
| Hold | 14 | |
| Sell | 0 | |
| Strong Sell | 0 |
Conclusion
Jacobs Solutions Inc. shows strong potential in a diversified industry with growing infrastructure needs. While the fundamental ratings highlight some caution due to its debt, the consistent historical performance and optimistic analyst consensus suggest promising growth opportunities. Potential investors should monitor market trends and industry shifts. The consensus among analysts leans towards a buy, reflecting beliefs in future appreciation. Caution is advised given the current economic conditions globally.
Smart Data Insight
Master the Perfect Entry & Exit for this Stock
Don't leave your profits to chance. Historically, this stock follows specific seasonal patterns that institutional traders use to maximize returns.
- ✅ Identify the "Golden Buying Window"
- ✅ Avoid high-risk correction cycles
- ✅ Backtested data from the last 20+ years