May 18, 2026 a 11:31 am

📊 Dividend Analysis - Jacobs Solutions Inc.
Jacobs Solutions Inc. presents a promising dividend profile with a current yield of 1.23%, reflecting its commitment to shareholder returns. Over its 13-year dividend history, the company has demonstrated stability, with no recent cuts or suspensions. However, the modest dividend growth rate suggests a steady approach to increases. Investors should consider the growth potential along with the solid payout ratios and overall financial health.
🗣️ Overview
The company operates in a sector where stability and gradual growth are preferred. The current dividend yield of 1.23% and a dividend track record of 13 years underline a stable income source for investors. The last cut or suspension of dividends being unrecorded signifies the company's resilience in maintaining its payout.
| Metric | Value |
|---|---|
| Sector | Engineering & Construction |
| Dividend Yield | 1.23% |
| Current Dividend Per Share | 1.27 USD |
| Dividend History | 13 years |
| Last Cut or Suspension | None |
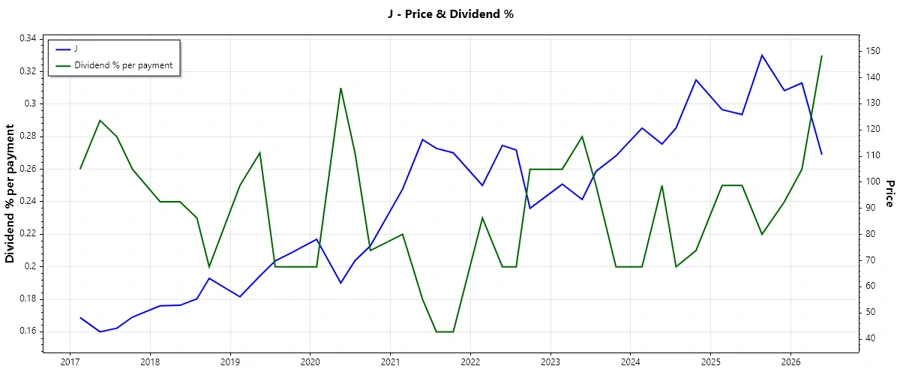
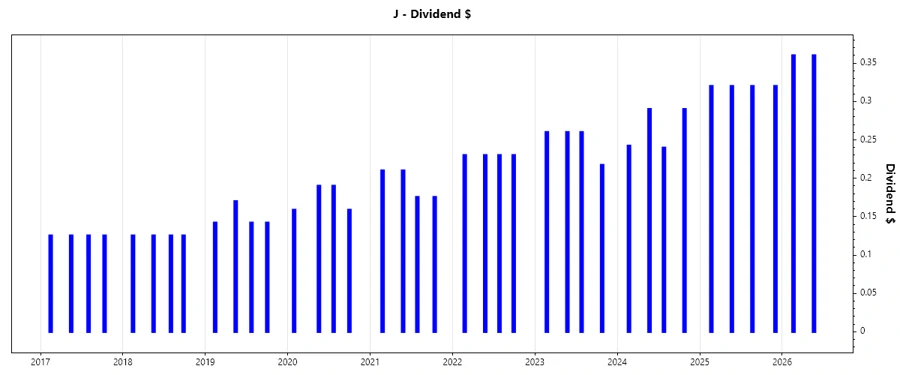
📉 Dividend History
Understanding dividend payments over time reveals a company's commitment to its shareholders. Regular increments indicate financial health and a nod towards shareholder value maximization.
| Year | Dividend Per Share (USD) |
|---|---|
| 2026 | 0.72 |
| 2025 | 1.28 |
| 2024 | 1.06 |
| 2023 | 0.99 |
| 2022 | 0.92 |
📈 Dividend Growth
Dividend growth is pivotal for long-term investors seeking income that keeps pace with inflation. Jacobs Solutions has managed to grow its dividends, indicating an optimistic forward-looking investment.
| Time | Growth |
|---|---|
| 3 years | 11.64% |
| 5 years | 12.91% |
The average dividend growth is 12.91% over 5 years. This shows moderate but steady dividend growth.
⚖️ Payout Ratio
Payout ratios are crucial for assessing a company's ability to sustainably pay dividends. A low ratio suggests room for growth, whereas a high ratio may indicate risk.
| Key Figure | Ratio |
|---|---|
| EPS-based | 39.33% |
| Free Cash Flow-based | 31.08% |
The EPS-based payout ratio of 39.33% and free cash flow-based ratio of 31.08% are both within a comfortable range, indicating financial flexibility in maintaining or growing dividends.
💵 Cashflow & Capital Efficiency
The financial metrics point towards the capability of the company to generate cash flow and efficiently manage its capital investments, ensuring continued investor returns.
| Metric | 2023 | 2024 | 2025 |
|---|---|---|---|
| Free Cash Flow Yield | 5.86% | 5.79% | 3.42% |
| Earnings Yield | 4.66% | 5.00% | 1.63% |
| CAPEX to Operating Cash Flow | 14.10% | 11.48% | 11.54% |
| Stock-based Compensation to Revenue | 0.68% | 0.65% | 0.51% |
| Free Cash Flow / Operating Cash Flow Ratio | 85.90% | 88.52% | 88.46% |
The results reflect a solid ability to cover dividends with cash flow and effective capital utilization. Continued attention to capital efficiency enhances potential returns.
🏛️ Balance Sheet & Leverage Analysis
Analyzing leverage and liquidity ratios offers insight into the company's ability to manage debt and maintain financial stability through volatile markets.
| Metric | 2023 | 2024 | 2025 |
|---|---|---|---|
| Debt-to-Equity | 0.53 | 0.60 | 0.74 |
| Debt-to-Assets | 0.24 | 0.23 | 0.24 |
| Debt-to-Capital | 0.35 | 0.38 | 0.43 |
| Net Debt to EBITDA | 2.71 | 1.28 | 1.59 |
| Current Ratio | 1.37 | 1.20 | 1.30 |
| Quick Ratio | 1.37 | 1.20 | 1.30 |
| Financial Leverage | 2.23 | 2.58 | 3.09 |
The company's balance sheet portrays manageable leverage with improvement over recent years, instilling confidence in its ability to handle obligations without compromising growth.
📈 Fundamental Strength & Profitability
Key profitability and efficiency indicators measure a company's ability to generate earnings relative to revenue and investment.
| Metric | 2023 | 2024 | 2025 |
|---|---|---|---|
| Return on Equity | 10.17% | 17.72% | 7.97% |
| Return on Assets | 4.55% | 6.86% | 2.58% |
| ROIC | 4.79% | 6.63% | 6.50% |
| Net Margin | 6.14% | 7.01% | 2.41% |
| EBIT Margin | 6.35% | 8.23% | 5.73% |
| EBITDA Margin | 9.18% | 10.91% | 7.70% |
| Gross Margin | 24.98% | 24.63% | 24.81% |
Profitability ratios underscore the company's robust margin controls and effective use of resources to drive earnings, cementing its position as a lucrative investment.
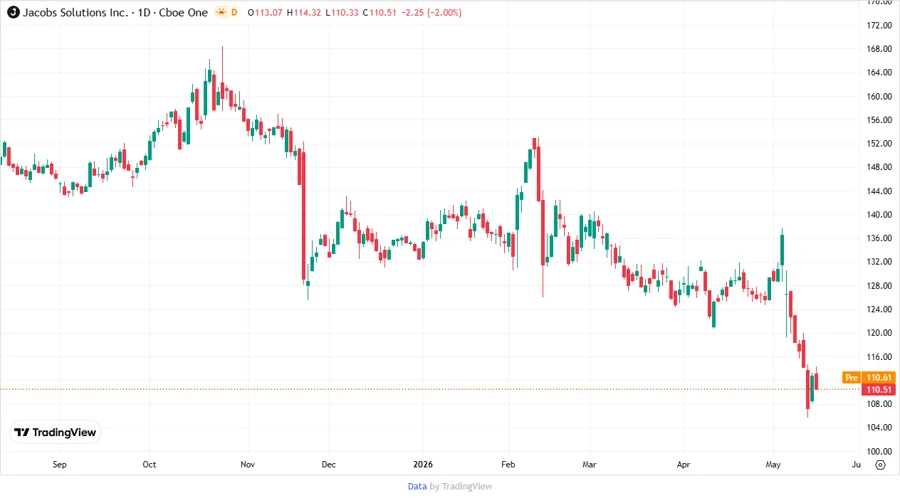
🚀 Price Development
🔍 Dividend Scoring System
This scoring system evaluates various dividend-related attributes rigorously, providing a composite score indicative of investment quality.
| Criteria | Score (1-5) | Score Bar |
|---|---|---|
| Dividend Yield | 3 | |
| Dividend Stability | 4 | |
| Dividend Growth | 3 | |
| Payout Ratio | 4 | |
| Financial Stability | 4 | |
| Dividend Continuity | 5 | |
| Cashflow Coverage | 4 | |
| Balance Sheet Quality | 4 |
Overall Score: 31 out of 40
✅ Rating
Jacobs Solutions Inc. maintains a stable dividend policy with a potential for moderate growth. Its commitment to shareholder returns, efficient cash flow management, and robust balance sheet position it as a reliable income investment. Recommend considering for a balanced portfolio with a focus on stability and gradual growth.
Smart Data Insight
Master the Perfect Entry & Exit for this Stock
Don't leave your profits to chance. Historically, this stock follows specific seasonal patterns that institutional traders use to maximize returns.
- ✅ Identify the "Golden Buying Window"
- ✅ Avoid high-risk correction cycles
- ✅ Backtested data from the last 20+ years