February 12, 2026 a 02:46 am
J: Dividend Analysis - Jacobs Solutions Inc.
Jacobs Solutions Inc. has demonstrated a credible dividend history with growth over recent years. The company's robust financial metrics suggest a strong foundation for future dividend sustainability. However, the dividend yield remains relatively low compared to industry peers, indicating potential for growth but also pointing towards modest current income. Investors should weigh the dividend growth potential against the lower yield when considering an investment in J. Overall, J presents a stable yet somewhat conservative dividend profile.
📊 Overview
The dividend yield for Jacobs Solutions Inc. is relatively modest, reflecting a strategy that prioritizes growth and reinvestment. Key metrics such as the consistent 13-year dividend history, and an absence of dividend cuts strengthen confidence in the firm’s commitment to returning value to shareholders.
| Metric | Value |
|---|---|
| Sector | Engineering and Construction |
| Dividend yield | 0.93% |
| Current dividend per share | 1.27 USD |
| Dividend history | 13 years |
| Last cut or suspension | None |
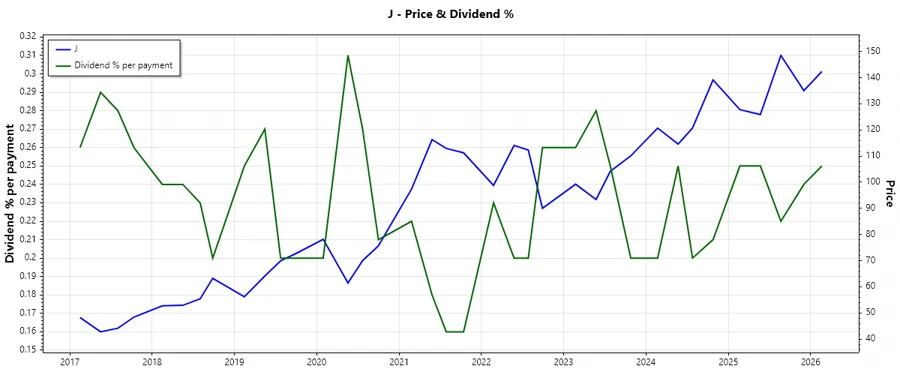
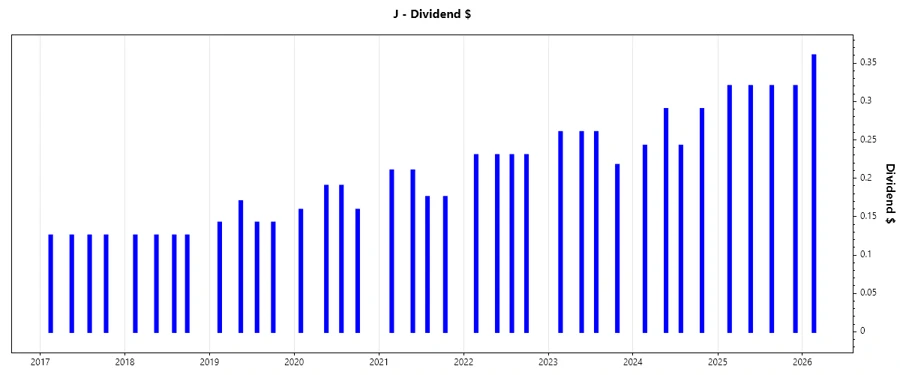
📈 Dividend History
Jacobs Solutions Inc.'s historical data reveals a resilient commitment to dividend payouts, essential for investors seeking income consistency. The pivotal role played by dividends in total shareholder returns makes this consistency indispensable.
| Year | Dividend per Share (USD) |
|---|---|
| 2026 | 0.36 |
| 2025 | 1.28 |
| 2024 | 1.065 |
| 2023 | 0.997 |
| 2022 | 0.92 |
📈 Dividend Growth
The growth rate of dividends provides insights into a company's future payout potential and financial health. Jacobs Solutions Inc. maintains moderate yet consistent dividend growth.
| Time | Growth |
|---|---|
| 3 years | 11.64% |
| 5 years | 12.91% |
The average dividend growth is 12.91% over 5 years. This shows moderate but steady dividend growth, indicating a commitment to enhancing shareholder returns.
⚠️ Payout Ratio
The payout ratio is key in assessing sustainability. Low ratios often mean dividends are well-covered by profits, ensuring stability even during downturns.
| Key Figure | Ratio |
|---|---|
| EPS-based | 34.68% |
| Free cash flow-based | 17.19% |
The relatively low EPS payout ratio of 34.68% and FCF payout ratio of 17.19% suggest that dividends are sustainably covered, giving leeway for potential future increases.
📊 Cashflow & Capital Efficiency
Robust free cash flows are fundamental for sustaining and growing dividend payouts, as they reflect a company’s ability to generate cash in excess of operational costs.
| Metric | 2025 | 2024 | 2023 |
|---|---|---|---|
| Free Cash Flow Yield | 3.42% | 5.79% | 5.86% |
| Earnings Yield | 1.63% | 5.00% | 4.66% |
| CAPEX to Operating Cash Flow | 11.54% | 11.48% | 14.10% |
| Stock-based Compensation to Revenue | 0.41% | 0.65% | 0.69% |
| Free Cash Flow / Operating Cash Flow Ratio | 88.46% | 88.52% | 85.90% |
The consistent free cash flow yield underscores Jacobs Solutions Inc.'s capacity to support dividend payouts while investing in growth opportunities, ensuring robust capital efficiency.
📊 Balance Sheet & Leverage Analysis
A strong balance sheet with manageable leverage is vital for weathering economic downturns, maintaining liquidity, and ensuring the capacity for ongoing dividend payments.
| Metric | 2025 | 2024 | 2023 |
|---|---|---|---|
| Debt-to-Equity | 0.74 | 0.60 | 0.53 |
| Debt-to-Assets | 0.24 | 0.23 | 0.24 |
| Debt-to-Capital | 0.43 | 0.38 | 0.35 |
| Net Debt to EBITDA | 1.59 | 1.28 | 2.71 |
| Current Ratio | 1.30 | 1.20 | 1.37 |
| Quick Ratio | 1.30 | 1.20 | 1.37 |
| Financial Leverage | 3.09 | 2.58 | 2.23 |
Jacobs Solutions Inc.'s leverage ratios indicate a balanced debt strategy, allowing for flexibility during economic shifts while supporting dividend consistency.
📊 Fundamental Strength & Profitability
Profitability metrics such as ROE and margins reflect a company’s efficiency in managing resources, crucial for sustaining competitive advantage and consistent cash flows.
| Metric | 2025 | 2024 | 2023 |
|---|---|---|---|
| Return on Equity | 7.97% | 17.72% | 10.17% |
| Return on Assets | 2.58% | 6.86% | 4.55% |
| Net Margin | 2.41% | 7.01% | 6.14% |
| EBIT Margin | 5.73% | 8.23% | 6.35% |
| EBITDA Margin | 7.70% | 10.91% | 9.18% |
| Gross Margin | 24.81% | 24.63% | 24.98% |
| R&D to Revenue | 0.10% | 0.11% | 0.00% |
Jacobs Solutions Inc.'s solid profitability ratios underscore its operational efficiency, supporting its dividend strategy and enabling reinvestment into growth avenues.
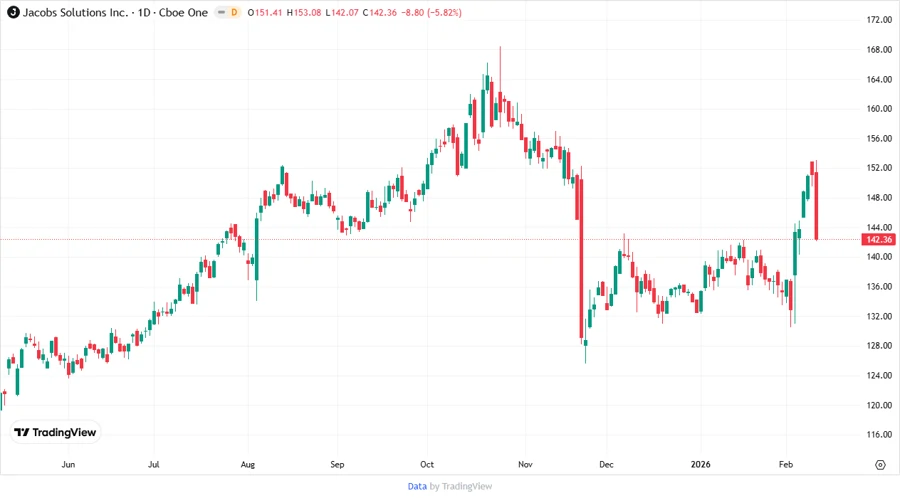
📈 Price Development
⚠️ Dividend Scoring System
| Category | Score | Bar |
|---|---|---|
| Dividend yield | 2 | |
| Dividend stability | 5 | |
| Dividend growth | 4 | |
| Payout ratio | 5 | |
| Financial stability | 4 | |
| Dividend continuity | 5 | |
| Cashflow coverage | 4 | |
| Balance Sheet Quality | 4 |
Total Score: 33/40
🗣️ Rating
Jacobs Solutions Inc. delivers a comprehensive dividend package characterized by stability and growth potential. Though the yield is relatively low, its consistent dividend history and efficient payout ratios appeal to investors with a preference for fundamental strength and capital conservation. The company's robust financial health supports its dividend continuity and growth prospects, making it a compelling option for investors prioritizing long-term income stability.
Smart Data Insight
Master the Perfect Entry & Exit for this Stock
Don't leave your profits to chance. Historically, this stock follows specific seasonal patterns that institutional traders use to maximize returns.
- ✅ Identify the "Golden Buying Window"
- ✅ Avoid high-risk correction cycles
- ✅ Backtested data from the last 20+ years