July 25, 2025 a 01:15 pm
JPM: Trend and Support & Resistance Analysis - JPMorgan Chase & Co.
JPMorgan Chase & Co., a global financial services powerhouse, has shown a strong upward trend over the recent months, as indicated by its price movements and calculated EMAs. Dominating the financial markets with its vast array of services, JPM is on a progressive trajectory. Investors keen on banking stocks may find JPM an appealing option, given its stability and growth prospects.
Trend Analysis
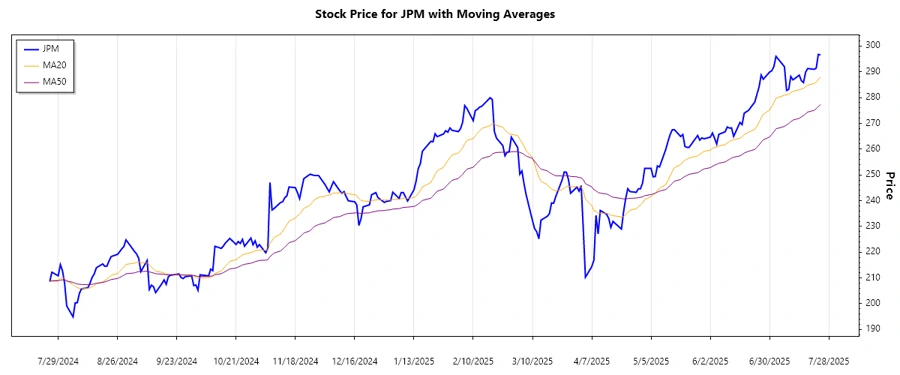
An examination of the calculated EMAs reveals an upward trend in JPMorgan Chase & Co.'s stock price. The 20-day EMA has consistently stayed above the 50-day EMA, signifying a bullish sentiment in the market.
| Date | Close Price | Trend |
|---|---|---|
| 2025-07-24 | $296.55 | ▲ Up |
| 2025-07-23 | $296.76 | ▲ Up |
| 2025-07-22 | $291.43 | ▲ Up |
| 2025-07-21 | $290.97 | ▲ Up |
| 2025-07-18 | $291.27 | ▲ Up |
| 2025-07-17 | $289.90 | ▲ Up |
| 2025-07-16 | $285.82 | ▲ Up |
This analysis shows consistent upward movement, indicating potential for further growth barring any major market disruptions.
Support and Resistance
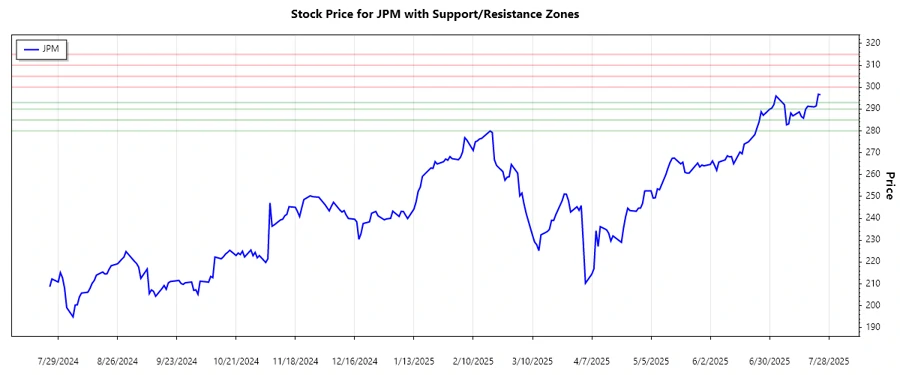
The analysis of support and resistance zones highlights strategic price levels for JPM stocks.
| Zone Type | From | To |
|---|---|---|
| Support Zone 1 | ▲ $290.00 | ▲ $293.00 |
| Support Zone 2 | ▲ $280.00 | ▲ $285.00 |
| Resistance Zone 1 | ▼ $300.00 | ▼ $305.00 |
| Resistance Zone 2 | ▼ $310.00 | ▼ $315.00 |
Currently, the stock price is approaching the first resistance zone, suggesting a potential hurdle, but breaching this level can indicate continued bullish momentum.
Conclusion
JPMorgan Chase & Co.'s stock is poised in a robust upward trend, with calculated EMAs affirming bullishness. Key support and resistance zones are identified, providing potential entry and exit points for investors. While overall prospects are favorable, vigilance for economic indicators impacting the financial sector is essential. Analysts should continue monitoring the stock for breakthroughs beyond resistance levels, which may signal sustained rally potential.
Note: Prices for support and resistance zones are indicative and should be refined with actual price data calculations from technical analysis tools based on historical price fluctuations.
Smart Data Insight
Master the Perfect Entry & Exit for this Stock
Don't leave your profits to chance. Historically, this stock follows specific seasonal patterns that institutional traders use to maximize returns.
- ✅ Identify the "Golden Buying Window"
- ✅ Avoid high-risk correction cycles
- ✅ Backtested data from the last 20+ years