May 26, 2025 a 04:44 pm

JPM: Fibonacci Analysis - JPMorgan Chase & Co.
The analysis of JPMorgan Chase & Co. stock reveals a recent dominant uptrend, demonstrating investor confidence in the company despite broader economic challenges. This strong performance suggests potential bullish momentum may continue, supported by the company's robust business segments. Technical indicators align with this trend, marking key price levels worth monitoring.
Fibonacci Analysis
| Information | Details |
|---|---|
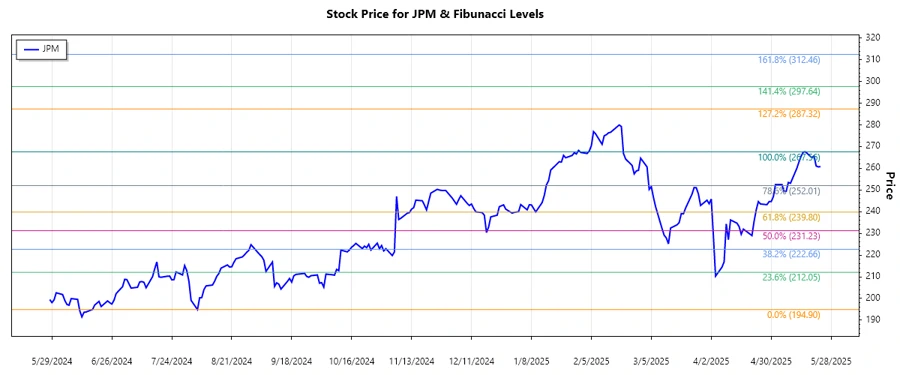
| Trend Start Date | 2024-11-05 |
| Trend End Date | 2025-05-16 |
| High Price | $267.56 on 2025-05-16 |
| Low Price | $194.90 on 2024-08-05 |
Fibonacci Levels
| Level | Price |
|---|---|
| 0.236 | $211.22 |
| 0.382 | $227.53 |
| 0.500 | $231.23 |
| 0.618 | $244.07 |
| 0.786 | $253.86 |
The current price of $260.71 suggests it is above the 0.786 retracement level. This may indicate a continuing uptrend, highlighting potential support around the $253.86 level which aligns with the 0.786 retracement. As the price remains near its high, investors may want to watch for any signs of momentum reversal.
Conclusion
JPMorgan Chase & Co's stock's recent upward trend underscores its resilience and investors' optimistic outlook, driven by its diverse service offerings. The stock's position near its high suggests sustained bullish sentiment, although caution is warranted as prices approach historical resistance levels. The Fibonacci retracement analysis indicates potential support around the $253.86 mark, offering a cautionary buffer against potential downswings. Analysts should remain vigilant for shifts in market conditions that could impact this trajectory.
Smart Data Insight
Master the Perfect Entry & Exit for this Stock
Don't leave your profits to chance. Historically, this stock follows specific seasonal patterns that institutional traders use to maximize returns.
- ✅ Identify the "Golden Buying Window"
- ✅ Avoid high-risk correction cycles
- ✅ Backtested data from the last 20+ years