September 13, 2025 a 02:47 am


JPM: Dividend Analysis - JPMorgan Chase & Co.
JPMorgan Chase & Co. (JPM) has showcased a consistent dividend-paying track record, contributing to its reputation as a reliable dividend stock. With a solid market capitalization, the company's financial standing bolsters its ability to maintain and potentially grow dividend payouts. However, investors should also keep an eye on the company's leverage metrics and payout ratios to ensure sustainable dividend payments in the long run.
📊 Overview
JPMorgan Chase & Co. operates within the financial sector, which is known for relatively stable dividend payouts. A dividend yield of 1.79% underscores the company's commitment to returning value to shareholders. With a current dividend per share of 5.14 USD and a robust dividend history of 42 years without recent cuts, the company positions itself as a reliable dividend payer.
| Metric | Value |
|---|---|
| Sector | Financial |
| Dividend Yield | 1.79% |
| Current Dividend per Share | 5.14 USD |
| Dividend History | 42 years |
| Last Cut or Suspension | None |
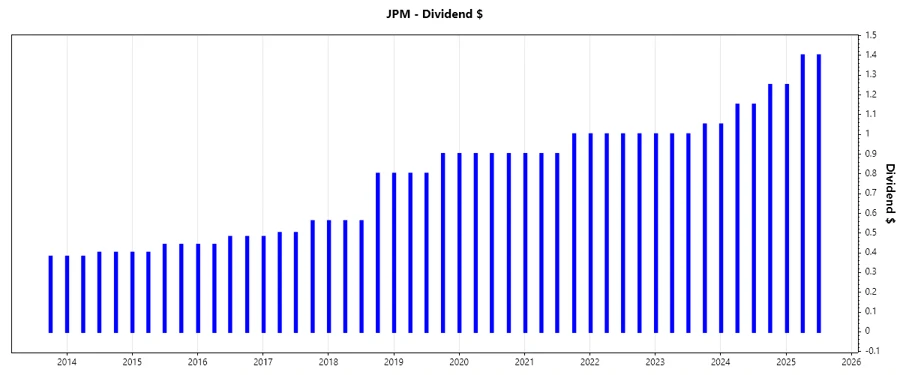
📈 Dividend History
JPMorgan's dividend history is significant, showcasing the company's commitment to returning capital to shareholders. This reflects financial strength and stability over decades, a crucial factor for long-term investors.
| Year | Dividend Per Share (USD) |
|---|---|
| 2025 | 4.05 |
| 2024 | 4.60 |
| 2023 | 4.05 |
| 2022 | 4.00 |
| 2021 | 3.70 |
📉 Dividend Growth
JPM's recent dividend growth rates highlight a steady increase, which is an essential metric for those relying on dividends for income. Monitoring growth rates helps investors understand the company's potential to enhance shareholder returns.
| Time | Growth |
|---|---|
| 3 years | 7.53% |
| 5 years | 6.87% |
The average dividend growth is 6.87% over 5 years. This shows moderate but steady dividend growth.
🗣️ Payout Ratio
Payout ratios are critical in assessing the sustainability of dividend payments. A lower payout ratio indicates a company's ability to continue paying dividends, even during economic downturns.
| Key Figure | Ratio |
|---|---|
| EPS-based | 25.37% |
| Free cash flow-based | -9.52% |
With an EPS payout ratio of 25.37%, JPMorgan maintains a conservative approach to dividend payments. However, the negative FCF ratio might indicate cash flow challenges, warranting close monitoring.
✅ Cashflow & Capital Efficiency
Analyzing cash flow and capital efficiency is necessary to understand a company's operational efficiency and ability to generate free cash flow, which supports dividend payments.
| Year | 2024 | 2023 | 2022 |
|---|---|---|---|
| Free Cash Flow Yield | -6.10% | 2.60% | 26.93% |
| Earnings Yield | 8.49% | 9.91% | 9.47% |
| CAPEX to Operating Cash Flow | 0% | 0% | 0% |
| Stock-based Compensation to Revenue | 0% | 0% | 0% |
| Free Cash Flow / Operating Cash Flow Ratio | 1 | 1 | 1 |
Overall, the data reflects complex cash flow dynamics with variations in free cash flow yield, indicating inconsistent cash flow generation that may impact dividend sustainability.
⚠️ Balance Sheet & Leverage Analysis
The balance sheet's leverage ratios offer insight into the company's financial risk, informing if the company can withstand economic adversities while continuing dividend payments.
| Year | 2024 | 2023 | 2022 |
|---|---|---|---|
| Debt-to-Equity | 2.18 | 1.99 | 1.86 |
| Debt-to-Assets | 0.19 | 0.17 | 0.15 |
| Debt-to-Capital | 0.69 | 0.67 | 0.65 |
| Net Debt to EBITDA | 3.39 | 0.42 | -0.46 |
| Current Ratio | 0.30 | 0.30 | 0.29 |
| Quick Ratio | 0.30 | 0.30 | 0.29 |
| Financial Leverage | 11.61 | 11.82 | 12.54 |
The leverage ratios highlight an increase in debt over recent years, necessitating vigilance in monitoring the company's debt management strategies.
📉 Fundamental Strength & Profitability
Fundamentals such as Return on Equity (ROE) and profit margins indicate financial performance quality, essential for sustaining and growing dividends.
| Year | 2024 | 2023 | 2022 |
|---|---|---|---|
| Return on Equity | 16.16% | 15.11% | 12.89% |
| Return on Assets | 1.46% | 1.28% | 1.03% |
| Margin (Net) | 21.59% | 20.97% | 24.49% |
| EBIT Margin | 27.73% | 26.08% | 30.01% |
| EBITDA Margin | 30.66% | 29.26% | 34.60% |
| Gross Margin | 58.64% | 61.65% | 78.92% |
Consistent profitability and efficient use of equity underpin JPM's potential to continue strong dividend payouts.
📈 Price Development
🗳️ Dividend Scoring System
| Criteria | Score (1-5) | Visual Score |
|---|---|---|
| Dividend Yield | 3 | |
| Dividend Stability | 5 | |
| Dividend Growth | 3 | |
| Payout Ratio | 4 | |
| Financial Stability | 4 | |
| Dividend Continuity | 5 | |
| Cashflow Coverage | 3 | |
| Balance Sheet Quality | 3 |
Total Score: 30/40
📝 Rating
In summary, JPMorgan Chase & Co. is a strong dividend-paying stock with a solid track record. However, due to varying cash flow metrics, attention is needed in tracking their financial strategies. Investors looking for steady long-term dividend income might find this stock appealing, given its exemplary dividend stability and continuity.
Smart Data Insight
Master the Perfect Entry & Exit for this Stock
Don't leave your profits to chance. Historically, this stock follows specific seasonal patterns that institutional traders use to maximize returns.
- ✅ Identify the "Golden Buying Window"
- ✅ Avoid high-risk correction cycles
- ✅ Backtested data from the last 20+ years