
July 23, 2026 a 02:03 pm

JNJ: Trend and Support & Resistance Analysis - Johnson & Johnson
As a leading company in the healthcare field, Johnson & Johnson exhibits a robust product portfolio and market position. Despite market fluctuations, it shows a potential for consistent growth driven by its diversified business segments. Investors should consider both the innovative and MedTech segments as key growth drivers. Considering the current market structure and trends, JNJ's stock can provide a balanced risk-reward opportunity.
Trend Analysis
| Date | Close Price | Trend |
|---|---|---|
| 2026-07-23 | 255.53 | ▲ Upward |
| 2026-07-22 | 255.63 | ▲ Upward |
| 2026-07-21 | 250.61 | ▲ Upward |
| 2026-07-20 | 248.82 | ▲ Upward |
| 2026-07-17 | 253.04 | ▲ Upward |
| 2026-07-16 | 249.97 | ▲ Upward |
| 2026-07-15 | 247.02 | ▲ Upward |
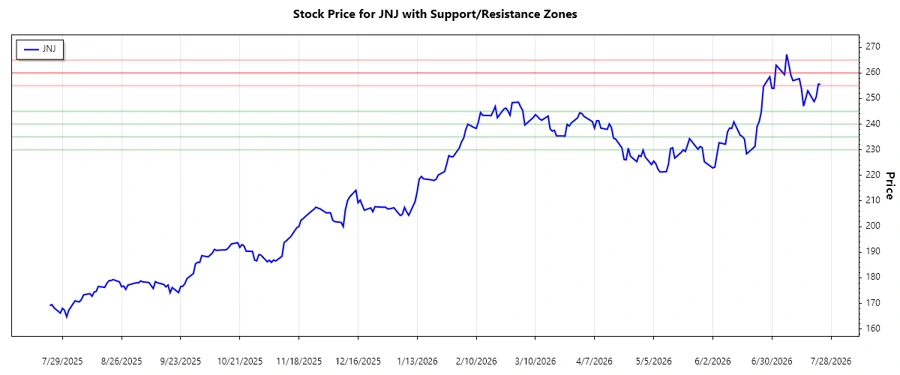
The recent trend indicates a steady upward motion as the EMA20 is consistently above the EMA50. Technically, this is a bullish sign, suggesting a potential continuation of the existing uptrend.
Support and Resistance
| Zone Type | From | To |
|---|---|---|
| Support | 240.00 | 245.00 |
| Support | 230.00 | 235.00 |
| Resistance | 260.00 | 265.00 |
| Resistance | 255.00 | 260.00 |
The current price is within the support zone between 240.00 and 245.00, suggesting a potential place for investors to consider buying. However, a breach below this support could imply a trend reversal.
Conclusion
Johnson & Johnson embodies a stable investment choice within the healthcare sector, backed by a historically upward trajectory in stock prices. Current technical indicators, notably the EMA20 exceeding EMA50, highlight a bullish trend. However, investors should remain vigilant of potential price pressures near identified resistance zones. With robust support levels, the stock provides a protective buffer against volatility. In conclusion, while promising opportunities reside, it is crucial to weigh inherent market risks and conduct broader financial analyses complementary to this technical approach.
Smart Data Insight
Master the Perfect Entry & Exit for this Stock
Don't leave your profits to chance. Historically, this stock follows specific seasonal patterns that institutional traders use to maximize returns.
- ✅ Identify the "Golden Buying Window"
- ✅ Avoid high-risk correction cycles
- ✅ Backtested data from the last 20+ years