October 13, 2025 a 01:15 pm
JNJ: Trend and Support & Resistance Analysis - Johnson & Johnson
Johnson & Johnson's stock has recently shown a strong upward recovery following a period of consolidation. The company's diverse business operations in healthcare provide stability against market fluctuations, and the latest technical indicators suggest a bullish phase in the market. The recent alignment of key EMAs supports an optimistic prospect for short to mid-term gains.
Trend Analysis
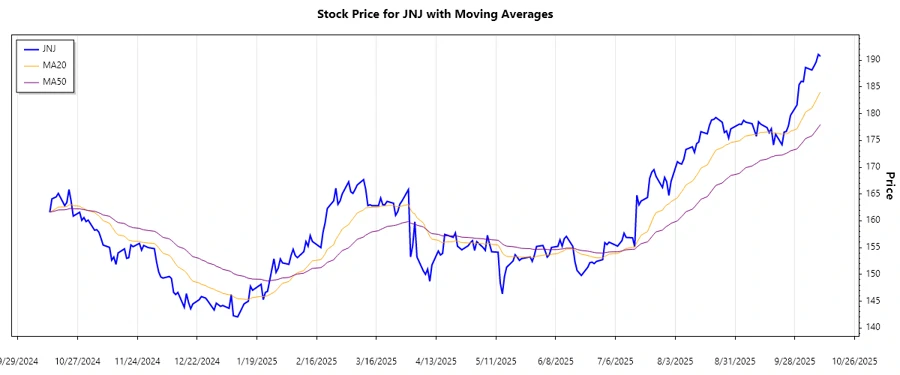
The recent price movements for Johnson & Johnson demonstrate a notable upward trend. Calculating the EMAs, the EMA20 is currently above the EMA50, signaling a continued bullish momentum.
| Date | Closing Price | Trend |
|---|---|---|
| 2025-10-10 | 190.72 | ▲ |
| 2025-10-09 | 191.08 | ▲ |
| 2025-10-08 | 189.69 | ▲ |
| 2025-10-07 | 188.89 | ▲ |
| 2025-10-06 | 188.16 | ▲ |
| 2025-10-03 | 188.64 | ▲ |
| 2025-10-02 | 185.98 | ▼ |
The indicator alignment suggests that the bullish trend is likely to continue, subject to market conditions. The stock is currently showing significant recovery capabilities.
Support- and Resistance
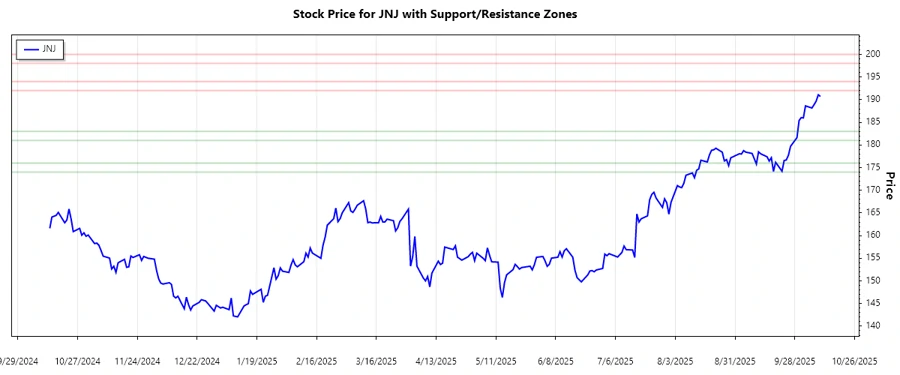
Analysis of the recent price data indicates potential support and resistance zones. These zones help identify favorable entry and exit points for traders.
| Zone Type | Price Range |
|---|---|
| Support 1 | 174.00 - 176.00 ▲ |
| Support 2 | 181.00 - 183.00 ▲ |
| Resistance 1 | 192.00 - 194.00 ▼ |
| Resistance 2 | 198.00 - 200.00 ▼ |
Currently, the stock is approaching a resistance zone, suggesting caution and reassessment of positions might be prudent around these levels to manage risk effectively.
Conclusion
In summary, Johnson & Johnson's stock exhibits a robust upward trend, with key metrics showing favorable conditions for bullish strategies. The company's diverse product portfolio supports resilience within volatile markets. However, approaching resistance levels may necessitate strategic maneuvers to capitalize on profits while minimizing potential downside risks. Overall, market analysts should consider these dynamics as they project future stock performance.
Smart Data Insight
Master the Perfect Entry & Exit for this Stock
Don't leave your profits to chance. Historically, this stock follows specific seasonal patterns that institutional traders use to maximize returns.
- ✅ Identify the "Golden Buying Window"
- ✅ Avoid high-risk correction cycles
- ✅ Backtested data from the last 20+ years