September 05, 2025 a 05:15 am
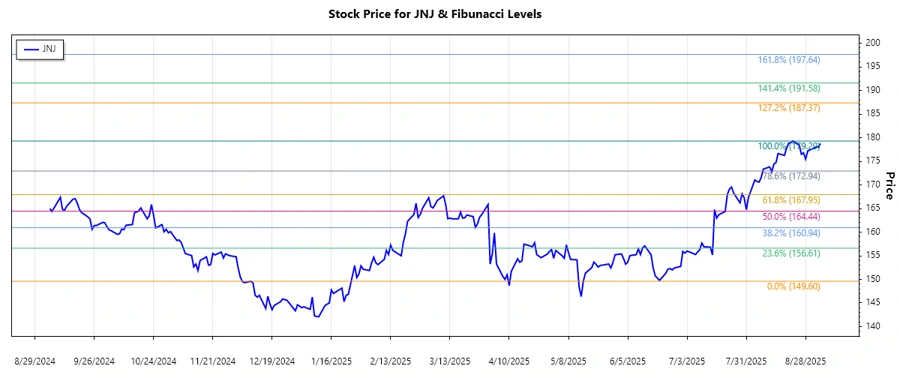
JNJ: Fibonacci Analysis - Johnson & Johnson
Johnson & Johnson's stock has recently shown a strong upward trend. Driven by its diverse product range, particularly in the healthcare sector, the company continues to innovate and expand its market presence. Despite global market challenges, JNJ's resilience and strategic investments position it well for future growth. An analysis of its price movements will provide further insights into potential support and resistance levels.
Fibonacci Analysis
| Detail | Value |
|---|---|
| Trend Start Date | 2024-12-09 |
| Trend End Date | 2025-08-22 |
| High Point Date | 2025-08-22 |
| High Point Price | 179.29 |
| Low Point Date | 2024-12-09 |
| Low Point Price | 149.60 |
Fibonacci Levels
| Level | Price |
|---|---|
| 0.236 | 157.2 |
| 0.382 | 161.79 |
| 0.5 | 164.45 |
| 0.618 | 167.11 |
| 0.786 | 171.17 |
The current price is $178.76, which is above the Fibonacci retracement levels, indicating it is outside the retracement zone. This could suggest a strong bullish momentum, with potential resistance around $179.29, the recent high.
Conclusion
Johnson & Johnson's impressive upward trajectory from late 2024 to mid-2025 has set a robust precedent for continued growth. The current price surpasses key Fibonacci levels, showcasing robust bullish momentum. However, investors should stay vigilant with potential resistance near historical highs. Strategy-wise, maintaining an awareness of global healthcare trends and competitive pressures is crucial to optimizing potential gains. While the technical outlook is optimistic, external factors such as regulatory changes and market volatility merit continuous monitoring.
Smart Data Insight
Master the Perfect Entry & Exit for this Stock
Don't leave your profits to chance. Historically, this stock follows specific seasonal patterns that institutional traders use to maximize returns.
- ✅ Identify the "Golden Buying Window"
- ✅ Avoid high-risk correction cycles
- ✅ Backtested data from the last 20+ years