August 06, 2025 a 06:44 am

JNJ: Fibonacci Analysis - Johnson & Johnson
Johnson & Johnson (JNJ) has shown a strong upward trend in recent months, demonstrating resilience across its diverse healthcare segments. As a key player in consumer health, pharmaceuticals, and MedTech, JNJ's performance suggests potential growth opportunities, driven by its wide-ranging product offerings in vital medical fields. Investors will find the technical analysis, especially the Fibonacci retracement, insightful for identifying potential strategic trading levels.
Fibonacci Analysis
| Parameter | Details |
|---|---|
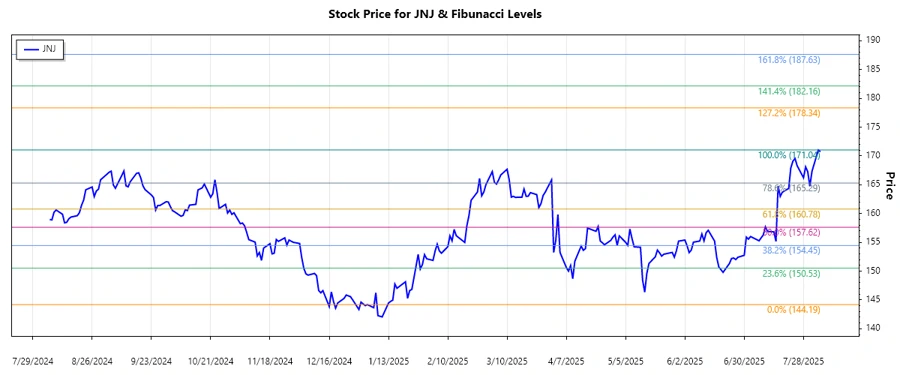
| Start Date | 2024-12-06 |
| End Date | 2025-08-05 |
| High Point | $171.04 on 2025-08-04 |
| Low Point | $144.19 on 2025-01-03 |
| Fibonacci Levels |
|
| Current Price | $170.74 |
| Retracement Zone | 0.786 |
| Interpretation | The current price is within the 0.786 retracement level, which might act as a resistance. If broken, it could signal further bullish momentum, whereas holding below might indicate consolidation or potential reversal. |
Conclusion
Johnson & Johnson's stock has exhibited a substantial uptrend, sustained by its robust market position across its business segments. The Fibonacci analysis highlights that the stock is currently testing significant resistance at the 0.786 retracement level. A successful breach above this level could potentially unlock further upward movement. However, investors should remain cautious of potential pullbacks. Given the company's stable market sectors, short to mid-term prospects remain promising, with strategic technical levels to consider for potential entry or exit points.