April 27, 2026 a 03:31 am


JNJ: Dividend Analysis - Johnson & Johnson
Johnson & Johnson, a stalwart in the healthcare sector, boasts a robust dividend history with consistent increases over the years. Its sustained growth and stable payout ratios reflect its commitment to shareholder returns. However, the modest yield calls for attention to potential market conditions and competitive pressures. Nevertheless, JNJ remains a pivotal choice for income-focused investors.
📊 Overview
Johnson & Johnson operates in the Healthcare sector, offering a stable dividend yield of 2.30%. The current dividend per share stands at $5.10, supported by an impressive 57-year streak of uninterrupted dividends, with no recent cuts or suspensions. This highlights the company's dedication to returning value to shareholders amidst healthcare market dynamics.
| Metric | Value |
|---|---|
| Sector | Healthcare |
| Dividend yield | 2.30% |
| Current dividend per share | $5.10 |
| Dividend history | 57 years |
| Last cut or suspension | None |
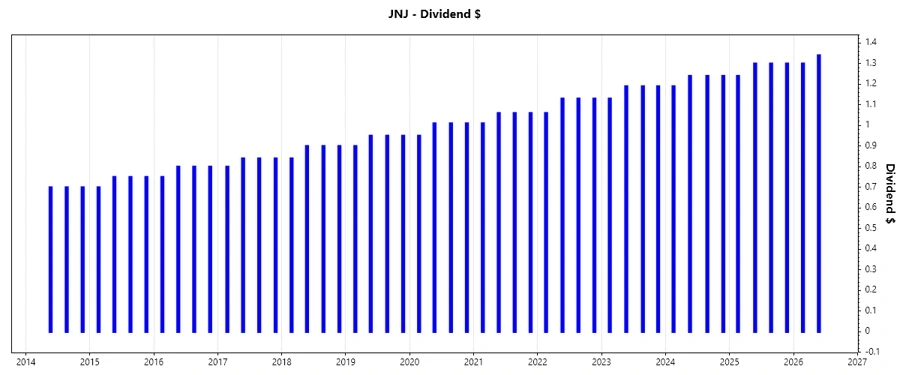
📈 Dividend History
Johnson & Johnson's historical dividend payments demonstrate a reliable increase over decades, making the stock a strong candidate for long-term dividend growth. This consistency is crucial for creating predictable income streams and building investor confidence. Below is the trend of dividend payments:
| Year | Dividend per share (USD) |
|---|---|
| 2026 | $2.64 |
| 2025 | $5.14 |
| 2024 | $4.91 |
| 2023 | $4.70 |
| 2022 | $4.45 |
📉 Dividend Growth
Understanding dividend growth is vital as it reflects the company’s capacity for increasing shareholder value through income. Johnson & Johnson experiences stable dividend growth over time, as depicted below:
| Time | Growth |
|---|---|
| 3 years | 4.92% |
| 5 years | 5.25% |
The average dividend growth is 5.25% over 5 years. This indicates moderate but steady dividend growth, reassuring for income-oriented investors.
✅ Payout Ratio
The payout ratio is a key indicator of how sustainable a dividend is, with Johnson & Johnson maintaining a balanced payout strategy:
| Key Figure | Ratio |
|---|---|
| EPS-based | 59.25% |
| Free cash flow-based | 68.95% |
A payout ratio of 59.25% from EPS and 68.95% from FCF suggests a balanced approach, allowing potential for reinvestment while keeping investor returns secure.
🗣️ Cashflow & Capital Efficiency
Robust cash flow and efficient capital use underpin sustainable dividend policies. Johnson & Johnson highlights its proficiency in these domains.
| Year | 2025 | 2024 | 2023 |
|---|---|---|---|
| Free Cash Flow Yield | 3.91% | 5.75% | 4.60% |
| Earnings Yield | 5.32% | 4.08% | 8.85% |
| CAPEX to Operating Cash Flow | 19.70% | 18.23% | 19.93% |
| Stock-based Compensation to Revenue | 1.44% | 1.32% | 1.36% |
| Free Cash Flow / Operating Cash Flow Ratio | 80.30% | 81.77% | 80.07% |
The cashflow data affirm robust capital efficiency and cash flow generation, essential for sustaining dividend payouts and reinvestment strategies.
⚠️ Balance Sheet & Leverage Analysis
Leverage metrics assess financial health and ability to meet long-term obligations. Johnson & Johnson's stability and liquid positioning are seen below:
| Year | 2025 | 2024 | 2023 |
|---|---|---|---|
| Debt-to-Equity | 0.59 | 0.51 | 0.43 |
| Debt-to-Assets | 0.24 | 0.20 | 0.18 |
| Debt-to-Capital | 0.37 | 0.34 | 0.30 |
| Net Debt to EBITDA | 0.69 | 0.51 | 0.32 |
| Current Ratio | 1.03 | 1.11 | 1.16 |
| Quick Ratio | 0.77 | 0.86 | 0.91 |
| Financial Leverage | 2.44 | 2.52 | 2.44 |
With solid leverage and liquidity metrics, Johnson & Johnson stands resilient in its debt management, vital for ensuring dividend longevity in various economic climates.
✅ Fundamental Strength & Profitability
Profitability ratios and returns showcase company efficiency and shareholder wealth creation. Johnson & Johnson excels in these areas.
| Year | 2025 | 2024 | 2023 |
|---|---|---|---|
| Return on Equity | 32.87% | 19.68% | 51.11% |
| Return on Assets | 13.46% | 7.81% | 20.98% |
| Net Margin | 28.46% | 15.84% | 41.28% |
| EBIT Margin | 35.62% | 19.64% | 18.59% |
| EBITDA Margin | 43.59% | 27.90% | 27.38% |
| Gross Margin | 72.78% | 69.07% | 68.82% |
| R&D to Revenue | 15.57% | 19.40% | 17.71% |
With strong profitability metrics and efficient R&D allocation, Johnson & Johnson proves its capacity to generate value and innovate within the healthcare sector.
📈 Price Development
🏆 Dividend Scoring System
| Criteria | Score (1-5) | Score Bar |
|---|---|---|
| Dividend yield | 3 | |
| Dividend Stability | 5 | |
| Dividend growth | 4 | |
| Payout ratio | 4 | |
| Financial stability | 4 | |
| Dividend continuity | 5 | |
| Cashflow Coverage | 4 | |
| Balance Sheet Quality | 5 |
Overall Score: 34/40
🗣️ Rating
Johnson & Johnson exhibits a strong dividend profile with exemplary stability and continuity, backed by its financial robustness. Its consistent dividend growth, coupled with efficient capital allocation, makes it a prime choice for conservative dividend investors seeking reliable income streams.
Smart Data Insight
Master the Perfect Entry & Exit for this Stock
Don't leave your profits to chance. Historically, this stock follows specific seasonal patterns that institutional traders use to maximize returns.
- ✅ Identify the "Golden Buying Window"
- ✅ Avoid high-risk correction cycles
- ✅ Backtested data from the last 20+ years