December 08, 2025 a 07:31 am


JNJ: Dividend Analysis - Johnson & Johnson
Johnson & Johnson offers a robust dividend profile with steady historical growth, making its stock a reliable income-generating asset for investors. With a strong market position and a long-standing tradition of increasing dividends for over 56 years, JNJ remains a top-tier choice for dividend-focused portfolios. The company’s solid financials reinforce its capability to sustain and grow its dividend payout over the years.
📊 Overview
Johnson & Johnson is a prominent player in the healthcare sector, boasting a healthy dividend yield of 2.49% with a dividend per share standing at $4.91. The company has a commendable dividend history, maintaining and increasing its payments consistently over the last 56 years without any suspensions or cuts.
| Metric | Value |
|---|---|
| Sector | Healthcare |
| Dividend Yield | 2.49% |
| Current Dividend per Share | $4.91 |
| Dividend History | 56 years |
| Last Cut or Suspension | None |
🗣️ Dividend History
Consistency in dividend payments is a hallmark of a strong company. JNJ has demonstrated resilience and commitment through its unbroken dividend history, providing investors with a trusted stream of income.
| Year | Dividend per Share (USD) |
|---|---|
| 2025 | $5.14 |
| 2024 | $4.91 |
| 2023 | $4.70 |
| 2022 | $4.45 |
| 2021 | $4.19 |
📈 Dividend Growth
Analyzing dividend growth is crucial as it indicates a company’s ability to increase its payouts to shareholders. This growth reflects both operational efficiency and favorable business conditions.
| Time | Growth |
|---|---|
| 3 years | 5.43% |
| 5 years | 5.54% |
The average dividend growth is 5.54% over 5 years. This shows moderate but steady dividend growth.
✅ Payout Ratio
The payout ratio is a pivotal measure of dividend sustainability. JNJ presents an EPS-based payout ratio of 47.48%, suggesting a balanced distribution of profits. Meanwhile, a Free Cash Flow-based ratio of 62.06% indicates ample liquidity for covering dividends.
| Key figure | Ratio |
|---|---|
| EPS-based | 47.48% |
| Free Cash Flow-based | 62.06% |
JNJ's payout ratios are healthy, providing comfort that dividends are well-covered by both earnings and cash flow.
🧮 Cashflow & Capital Efficiency
Understanding cash flow efficiency and capital allocation is fundamental for evaluating a company's financial health. JNJ exhibits good free cash flow yield and effective capital expenditures relative to operating cash flow, reflecting prudent financial management.
| Measure | 2024 | 2023 | 2022 |
|---|---|---|---|
| Free Cash Flow Yield | 5.75% | 4.60% | 3.72% |
| Earnings Yield | 4.08% | 8.85% | 3.89% |
| CAPEX to Operating Cash Flow | 18.23% | 19.93% | 18.92% |
| Stock-based Compensation to Revenue | 1.32% | 1.36% | 1.42% |
| Free Cash Flow / Operating Cash Flow Ratio | 81.77% | 80.07% | 81.08% |
JNJ maintains a stable cash flow, showcasing efficient capital management and strong operational performance through positive cash flow metrics.
🏦 Balance Sheet & Leverage Analysis
Assessing the balance sheet strength and leverage is essential for understanding financial resilience. JNJ’s conservative leverage ratios indicate stable financial footing with manageable debt levels, enhancing investor confidence in its long-term stability.
| Measure | 2024 | 2023 | 2022 |
|---|---|---|---|
| Debt-to-Equity | 0.53 | 0.43 | 0.52 |
| Debt-to-Assets | 0.21 | 0.18 | 0.21 |
| Debt-to-Capital | 0.35 | 0.30 | 0.34 |
| Net Debt to EBITDA | -0.30 | 0.32 | 1.01 |
| Current Ratio | 1.11 | 1.16 | 0.99 |
| Quick Ratio | 0.86 | 0.91 | 0.81 |
| Financial Leverage | 2.52 | 2.44 | 2.44 |
JNJ's leverage and liquidity ratios reflect prudence in financial structuring, supporting its robust dividend capabilities.
📊 Fundamental Strength & Profitability
Insights into profitability ratios and fundamental strengths underline a company’s operational prowess. JNJ demonstrates healthy margins across the board, with a strong Return on Equity and Return on Assets, representing efficient resource management.
| Measure | 2024 | 2023 | 2022 |
|---|---|---|---|
| Return on Equity | 19.68% | 51.11% | 23.36% |
| Return on Assets | 7.81% | 20.98% | 9.57% |
| Net Margin | 15.84% | 41.28% | 22.43% |
| EBIT Margin | 19.64% | 18.59% | 24.55% |
| EBITDA Margin | 27.90% | 27.38% | 33.26% |
| Gross Margin | 69.07% | 68.82% | 69.25% |
| R&D to Revenue | 17.05% | 17.71% | 17.67% |
JNJ's unwavering commitment to maintaining strong ROE and margin foundation signifies its adaptability and success in capturing market opportunities.
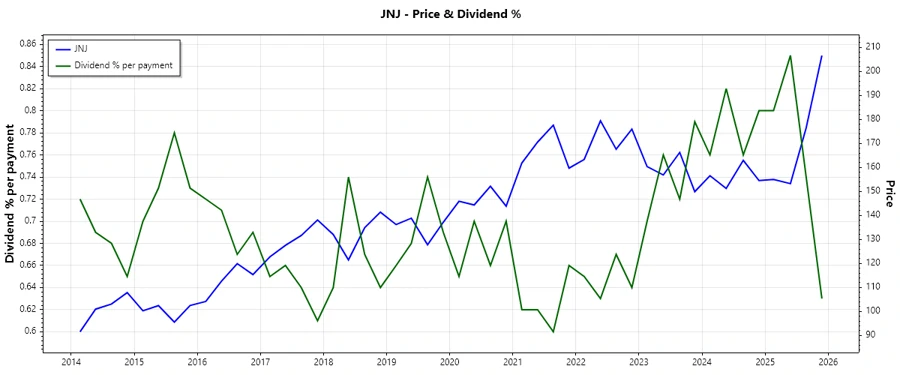
📉 Price Development
🔍 Dividend Scoring System
| Criteria | Score | Score Bar |
|---|---|---|
| Dividend yield | 4 | |
| Dividend Stability | 5 | |
| Dividend growth | 4 | |
| Payout ratio | 4 | |
| Financial stability | 5 | |
| Dividend continuity | 5 | |
| Cashflow Coverage | 4 | |
| Balance Sheet Quality | 5 |
Total Score: 36/40
⭐️ Rating
Johnson & Johnson's enduring financial strength and consistent dividend payment record make it a highly recommended investment for dividend-seeking investors. Its strategically balanced payout ratios and dependable cash flow structure solidify its standing as a prudent investment with steady returns. The stock maintains an exemplary status in dividend sustainability and growth potential.