November 11, 2025 a 03:31 am


JNJ: Dividend Analysis - Johnson & Johnson
Johnson & Johnson, with its robust dividend profile, stands as a beacon of reliability for dividend-focused investors. Offering a stable dividend yield, the company's financial strength and consistent dividend growth over decades make it an attractive choice. This analysis will delve into key aspects, providing insights into its sustained dividend payouts and growth potential.
Overview 📊
Johnson & Johnson, a leader in the healthcare sector, exhibits a compelling dividend track record. With a significant market capitalization and an uninterrupted dividend history spanning over 56 years, this company demonstrates an exemplary commitment to returning value to shareholders.
| Metric | Value |
|---|---|
| Sector | Healthcare |
| Dividend Yield | 2.73% |
| Current Dividend per Share | $4.91 |
| Dividend History | 56 years |
| Last Cut or Suspension | None |
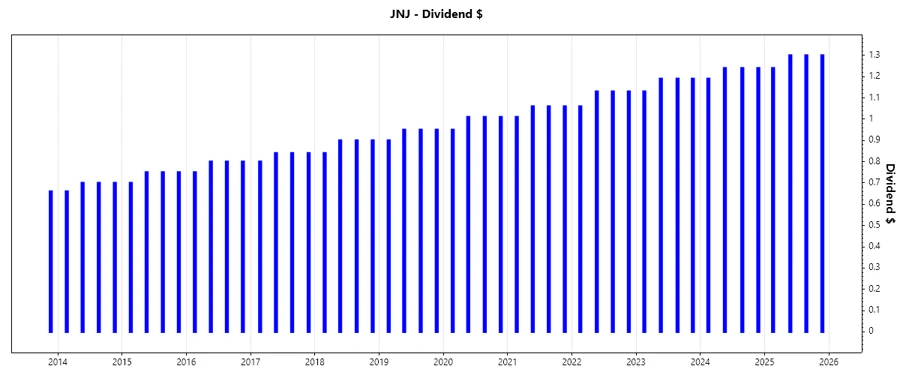
Dividend History 📉
The consistency of Johnson & Johnson's dividend history underscores its fiscal discipline and strategic planning. This reassurance of regular payouts is critical for investors seeking stable income streams.
| Year | Dividend per Share (USD) |
|---|---|
| 2025 | $5.14 |
| 2024 | $4.91 |
| 2023 | $4.70 |
| 2022 | $4.45 |
| 2021 | $4.19 |
Dividend Growth 📈
Assessing the dividend growth offers insights into future income potential. Johnson & Johnson's steady dividend growth suggests a sustainable framework, ensuring rising shareholder value.
| Time | Growth |
|---|---|
| 3 years | 5.43% |
| 5 years | 5.54% |
The average dividend growth is 5.54% over 5 years. This shows moderate but steady dividend growth.
Payout Ratio ✅
The payout ratio is a critical metric that evaluates how comfortably a company can sustain its dividend payouts relative to its earnings and cash flows.
| Key Figure | Ratio |
|---|---|
| EPS-based | 47.48% |
| Free Cash Flow-based | 62.07% |
With a 47.48% EPS payout ratio and 62.07% FCF payout ratio, Johnson & Johnson is effectively managing its earnings and cash flows to maintain dividend stability.
Cashflow & Capital Efficiency 💰
Analyzing cash flow and capital efficiency provides insights into the company’s financial robustness and ability to support long-term growth and dividends.
| Metric | 2022 | 2023 | 2024 |
|---|---|---|---|
| Free Cash Flow Yield | 3.72% | 4.60% | 5.75% |
| Earnings Yield | 3.89% | 8.85% | 4.08% |
| CAPEX to Operating Cash Flow | 18.92% | 19.93% | 18.23% |
| Stock-based Compensation to Revenue | 1.42% | 1.36% | 1.32% |
| Free Cash Flow / Operating Cash Flow Ratio | 81.08% | 80.07% | 81.77% |
The cash flow metrics indicate a strong cash generation capacity that bolsters dividend sustainability and potential for reinvestment in growth initiatives.
Balance Sheet & Leverage Analysis 🏦
Examining leverage ratios sheds light on Johnson & Johnson's financial leverage and ability to manage debt obligations, crucial for long-term stability.
| Metric | 2022 | 2023 | 2024 |
|---|---|---|---|
| Debt-to-Equity | 0.52 | 0.43 | 0.53 |
| Debt-to-Assets | 0.21 | 0.18 | 0.21 |
| Debt-to-Capital | 0.34 | 0.30 | 0.35 |
| Net Debt to EBITDA | 1.01 | 0.32 | 0.55 |
| Current Ratio | 0.99 | 1.16 | 1.11 |
| Quick Ratio | 0.81 | 0.91 | 0.86 |
| Financial Leverage | 2.44 | 2.44 | 2.52 |
The stable leverage ratios and strong solvency metrics highlight a well-structured balance sheet capable of withstanding financial shocks.
Fundamental Strength & Profitability 📊
The fundamental strength underscored by profitability metrics shows how efficiently Johnson & Johnson converts resources into profit, supporting sustainable dividends.
| Metric | 2022 | 2023 | 2024 |
|---|---|---|---|
| Return on Equity | 23.36% | 51.11% | 19.68% |
| Return on Assets | 9.57% | 20.98% | 7.81% |
| Margins: Net | 22.43% | 41.28% | 15.84% |
| EBIT | 24.55% | 18.59% | 19.64% |
| EBITDA | 33.26% | 27.38% | 27.90% |
| Gross | 69.25% | 68.82% | 69.07% |
| R&D to Revenue | 17.67% | 17.71% | 19.40% |
The strong profitability underscores Johnson & Johnson's efficient capital allocation, making it robustly positioned for maintaining and enhancing dividends.
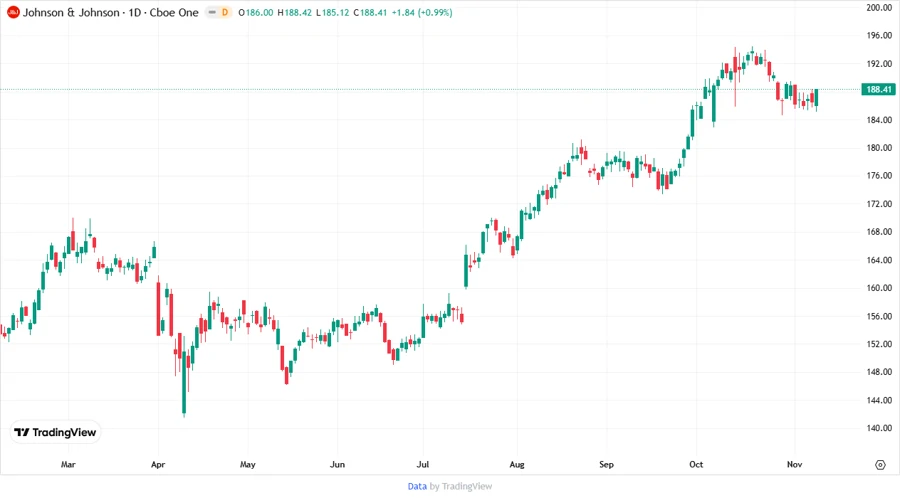
Price Development 📈
Dividend Scoring System ⚖️
| Category | Score | Score Bar |
|---|---|---|
| Dividend yield | 4 | |
| Dividend Stability | 5 | |
| Dividend growth | 4 | |
| Payout ratio | 4 | |
| Financial stability | 5 | |
| Dividend continuity | 5 | |
| Cashflow Coverage | 4 | |
| Balance Sheet Quality | 5 |
Total Score: 36/40
Rating 🗣️
Johnson & Johnson presents a compelling investment narrative for dividend-focused portfolios. The company's consistent dividend growth, combined with strong profitability metrics and financial stability, substantiate a favorable long-term investment outlook. The robust balance sheet and maintained dividend payouts render JNJ a safe bet for income-focused investors seeking sustainable yield expansion.
Smart Data Insight
Master the Perfect Entry & Exit for this Stock
Don't leave your profits to chance. Historically, this stock follows specific seasonal patterns that institutional traders use to maximize returns.
- ✅ Identify the "Golden Buying Window"
- ✅ Avoid high-risk correction cycles
- ✅ Backtested data from the last 20+ years