November 09, 2025 a 02:46 am


📊 JNJ: Dividend Analysis - Johnson & Johnson
The pharmaceutical giant Johnson & Johnson showcases an attractive dividend profile, characterized by a long history of steady increases. With a commendable yield and a robust history of 56 years without a cut, J&J signifies resilience and investor confidence. The company's payout ratios suggest sustainable dividends backed by stable cash flows and thoughtful capital allocation strategies.
Overview
Johnson & Johnson operates within the healthcare sector, a domain known for its defensive nature and sustained demand. With a dividend yield of 2.75%, it provides a reliable income stream, supported by a current dividend per share of 4.91 USD. Furthermore, JNJ's impressive dividend history stretches over 56 uninterrupted years, during which it has not faced any cuts or suspensions, underscoring its commitment to shareholders.
| Metric | Details |
|---|---|
| Sector | Healthcare |
| Dividend yield | 2.75% |
| Current dividend per share | 4.91 USD |
| Dividend history | 56 years |
| Last cut or suspension | None |
Dividend History
The impressive longevity of J&J's dividend payments reflects its operational stability and strategic foresight. The consistency in dividend increases is a testament to the company's robust cash flow generation. Recent payment history highlights resilience, even through economic fluctuations.
| Year | Dividend Per Share (USD) |
|---|---|
| 2025 | 5.14 |
| 2024 | 4.91 |
| 2023 | 4.70 |
| 2022 | 4.45 |
| 2021 | 4.19 |
Dividend Growth
Consistent dividend growth is crucial for long-term income investors, helping to offset inflation effects. J&J's growing dividends also reflect its increasing profitability and confidence in future earnings.
| Time | Growth |
|---|---|
| 3 years | 5.43% |
| 5 years | 5.54% |
The average dividend growth is 5.54% over 5 years. This shows moderate but steady dividend growth, reinforcing shareholder value through consistent income expansion.
Payout Ratio
Payout ratios provide insight into dividend sustainability. J&J's EPS-based payout ratio of 47.48% indicates a balanced approach between rewarding shareholders and retaining capital for growth.
| Key figure | Ratio |
|---|---|
| EPS-based | 47.48% |
| Free cash flow-based | 62.07% |
With an EPS payout ratio at 47.48% and FCF payout at 62.07%, J&J illustrates prudent financial management. These ratios support sustainable dividends without compromising reinvestment capacity.
Cashflow & Capital Efficiency
Evaluating J&J's cash flow metrics and capital efficiency reveals its operational strength. These metrics are pivotal in assessing the ability to generate sufficient cash to cover dividends and reinvest in the business.
| Metric | 2024 | 2023 | 2022 |
|---|---|---|---|
| Free Cash Flow Yield | 5.75% | 4.60% | 3.72% |
| Earnings Yield | 4.08% | 8.85% | 3.89% |
| CAPEX to Operating Cash Flow | 18.23% | 19.93% | 18.92% |
| Stock-based Compensation to Revenue | 1.32% | 1.36% | 1.42% |
| Free Cash Flow / Operating Cash Flow Ratio | 81.77% | 80.07% | 81.08% |
J&J's efficient capital allocation and solid cash flow generation underpin its dividend policy, supporting robust free cash flow relative to earnings.
Balance Sheet & Leverage Analysis
Financial leverage and balance sheet strength are critical for assessing long-term sustainability. J&J exhibits a healthy balance sheet, indicating prudent debt levels and strong liquidity.
| Metric | 2024 | 2023 | 2022 |
|---|---|---|---|
| Debt-to-Equity | 52.92% | 42.65% | 51.61% |
| Debt-to-Assets | 21.01% | 17.51% | 21.16% |
| Debt-to-Capital | 34.61% | 29.90% | 34.04% |
| Net Debt to EBITDA | 0.55x | 0.32x | 1.01x |
| Current Ratio | 1.11 | 1.16 | 0.99 |
| Quick Ratio | 0.86 | 0.91 | 0.81 |
| Financial Leverage | 2.52x | 2.44x | 2.44x |
J&J maintains strong liquidity and manageable leverage, enhancing its ability to sustain operations and dividend commitments through varying economic conditions.
Fundamental Strength & Profitability
Analyzing J&J's profitability metrics provides insights into its competitive edge and operational effectiveness.
| Metric | 2024 | 2023 | 2022 |
|---|---|---|---|
| Return on Equity | 19.68% | 51.11% | 23.36% |
| Return on Assets | 7.81% | 20.98% | 9.57% |
| Margins: Net | 15.84% | 41.28% | 22.43% |
| EBIT | 19.64% | 18.59% | 24.55% |
| EBITDA | 27.90% | 27.38% | 33.26% |
| Gross | 69.07% | 68.82% | 69.25% |
| Research & Development to Revenue | 17.05% | 17.71% | 17.67% |
J&J's strong profitability and solid fundamental metrics highlight its operational expertise and innovative capacity, supporting continuous dividend growth.
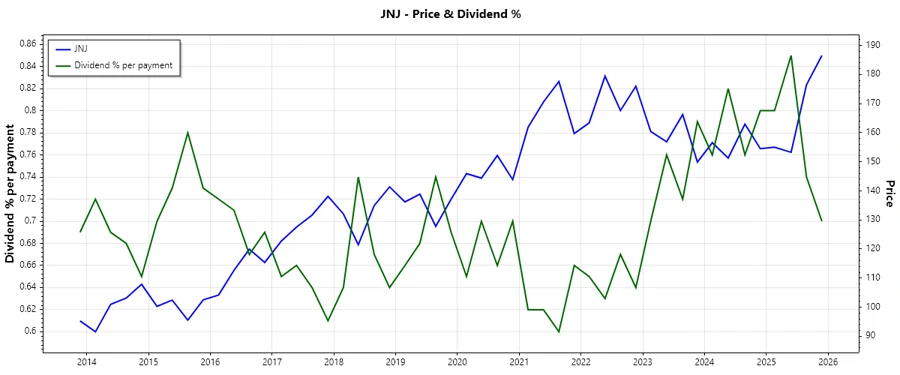
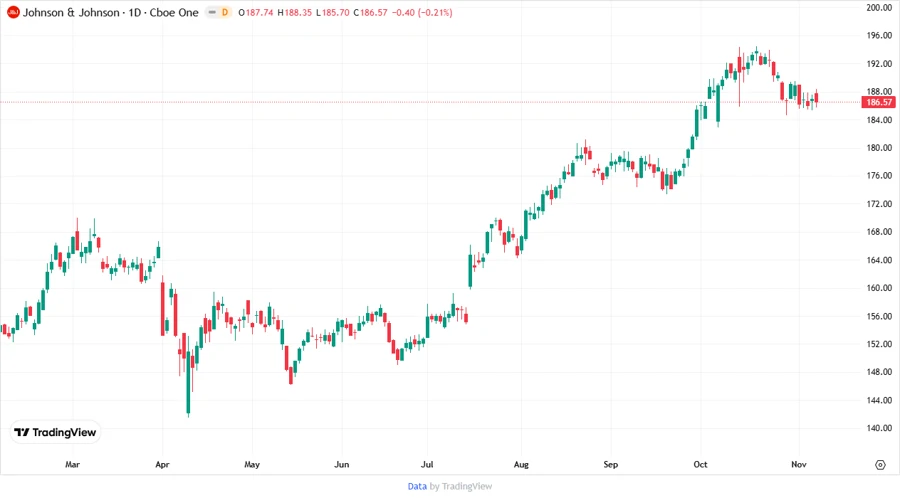
Price Development
Dividend Scoring System
| Criteria | Score | Score Bar |
|---|---|---|
| Dividend yield | 4 | |
| Dividend Stability | 5 | |
| Dividend growth | 4 | |
| Payout ratio | 4 | |
| Financial stability | 5 | |
| Dividend continuity | 5 | |
| Cashflow Coverage | 4 | |
| Balance Sheet Quality | 5 |
Total Score: 36/40
Rating
✅ Johnson & Johnson presents a formidable dividend profile with substantial strengths in stability and growth. The company's robust balance sheet, profitable operations, and disciplined capital allocation make it a compelling choice for dividend-focused investors seeking reliable, long-term income. Therefore, J&J is recommended as a strong dividend stock in the current market climate.
Smart Data Insight
Master the Perfect Entry & Exit for this Stock
Don't leave your profits to chance. Historically, this stock follows specific seasonal patterns that institutional traders use to maximize returns.
- ✅ Identify the "Golden Buying Window"
- ✅ Avoid high-risk correction cycles
- ✅ Backtested data from the last 20+ years