October 26, 2025 a 03:31 pm

JNJ: Dividend Analysis - Johnson & Johnson
Johnson & Johnson is a well-established company with a remarkable track record of dividend payouts. With a history of increasing dividends for 56 consecutive years, it offers both stability and reliability for dividend investors. The company’s dividend yield is attractive at 2.70%, coupled with a moderate growth rate, making it suitable for income-focused portfolios.
📊 Overview
Johnson & Johnson operates in the Pharmaceuticals and Consumer Health sector, well-known for its consistent financial performance and robust dividend strategy. It has maintained an impressive dividend yield of 2.70%, with a current dividend per share of $4.91. With an uninterrupted dividend history spanning 56 years and no recent cuts or suspensions, it presents a strong dividend profile.
| Description | Value |
|---|---|
| Sector | Pharmaceuticals |
| Dividend Yield | 2.70% |
| Current Dividend per Share | $4.91 |
| Dividend History | 56 years |
| Last Cut or Suspension | None |
🗣️ Dividend History
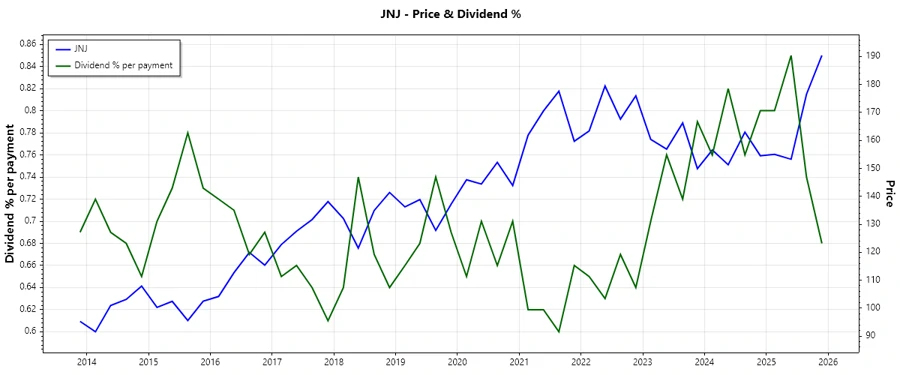
Johnson & Johnson’s extensive dividend history demonstrates its commitment to returning value to shareholders. This consistency is particularly important during economic uncertainties. Understanding the trend in dividend payouts helps assess future reliability.
| Year | Dividend Per Share |
|---|---|
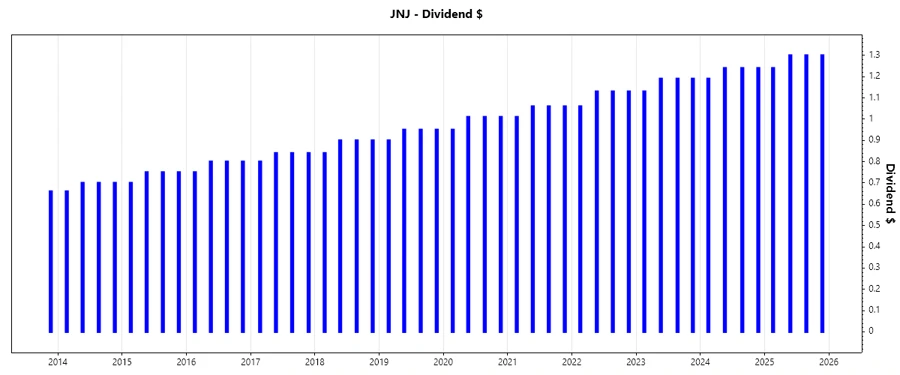
| 2025 | $5.14 |
| 2024 | $4.91 |
| 2023 | $4.70 |
| 2022 | $4.45 |
| 2021 | $4.19 |
📈 Dividend Growth
Dividend growth is a critical indicator of a company's earnings and financial health. Johnson & Johnson has shown a steady increment of dividends over the years.
| Time | Growth |
|---|---|
| 3 years | 5.43% |
| 5 years | 5.54% |
The average dividend growth is 5.54% over 5 years. This indicates moderate but steady dividend growth, signaling the company's stable economic foundation.
✅ Payout Ratio
Payout ratios reveal how much of the company's earnings are distributed as dividends, which in turn hints at the sustainability of those dividends.
| Key figure ratio | Value |
|---|---|
| EPS-based | 47.48% |
| Free cash flow-based | 72.16% |
The company maintains a healthy EPS payout ratio at 47.48%, balancing reinvestment against rewarding shareholders. The FCF ratio at 72.16% indicates a sufficient cash position to cover dividends without overextension.
📈 Cashflow & Capital Efficiency
Cashflow management is crucial for a company's operational efficiency and strategic funding.
| Year | 2022 | 2023 | 2024 |
|---|---|---|---|
| Free Cash Flow Yield | 3.72% | 4.60% | 5.75% |
| Earnings Yield | 3.89% | 8.85% | 4.08% |
| CAPEX to Operating Cash Flow | 18.92% | 19.93% | 18.23% |
| Stock-based Compensation to Revenue | 1.43% | 1.36% | 1.32% |
| Free Cash Flow / Operating Cash Flow Ratio | 81.08% | 80.07% | 81.77% |
Cashflow and capital efficiency indicators suggest strong management of operational funding and strategic investments, with a high percentage of available operating cash flow converted into free cash flow, showcasing financial stability and efficiency.
📊 Balance Sheet & Leverage Analysis
The balance sheet offers insights into company's long-term viability and financial security through leverage metrics.
| Year | 2022 | 2023 | 2024 |
|---|---|---|---|
| Debt-to-Equity | 52.61% | 42.65% | 52.92% |
| Debt-to-Assets | 21.16% | 17.51% | 21.01% |
| Debt-to-Capital | 34.04% | 29.90% | 34.61% |
| Net Debt to EBITDA | 1.01 | 0.32 | 0.55 |
| Current Ratio | 0.99 | 1.16 | 1.11 |
| Quick Ratio | 0.81 | 0.91 | 0.86 |
| Financial Leverage | 243.97% | 243.64% | 251.93% |
The financial leverage and various debt ratios reflect a balanced approach to leverage, allowing the company to maintain healthy liquidity ratios while strategically managing its debt obligations.
📉 Fundamental Strength & Profitability
Profitability metrics speak volumes about the operational excellence and core earning power of the business.
| Year | 2022 | 2023 | 2024 |
|---|---|---|---|
| Return on Equity | 23.36% | 51.11% | 19.68% |
| Return on Assets | 9.57% | 20.98% | 7.81% |
| Margins: Net | 22.43% | 41.28% | 15.84% |
| Margins: EBIT | 24.55% | 18.59% | 19.64% |
| Margins: EBITDA | 33.26% | 27.38% | 27.90% |
| Margins: Gross | 69.25% | 68.82% | 69.07% |
| R&D to Revenue | 17.67% | 17.71% | 19.40% |
Johnson & Johnson’s profitability ratios highlight efficient operations with high returns on equity and assets, bolstered by impressive margins, and consistent R&D investments showcase commitment to innovation.
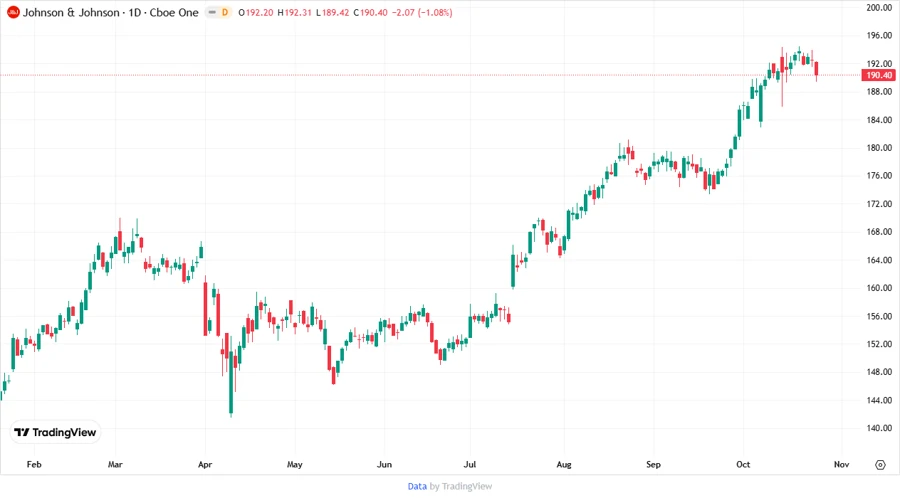
📈 Price Development
⬆️ Dividend Scoring System
| Criterion | Score | Bar |
|---|---|---|
| Dividend Yield | 4 | |
| Dividend Stability | 5 | |
| Dividend Growth | 3 | |
| Payout Ratio | 4 | |
| Financial Stability | 4 | |
| Dividend Continuity | 5 | |
| Cashflow Coverage | 4 | |
| Balance Sheet Quality | 4 |
Overall Score: 33/40
🗣️ Rating
Johnson & Johnson offers a robust dividend profile with stable yields, solid growth prospects, and a promising payout history. Its strong financial health makes it a reliable choice for dividend investors, meriting a solid "Buy" recommendation.
Smart Data Insight
Master the Perfect Entry & Exit for this Stock
Don't leave your profits to chance. Historically, this stock follows specific seasonal patterns that institutional traders use to maximize returns.
- ✅ Identify the "Golden Buying Window"
- ✅ Avoid high-risk correction cycles
- ✅ Backtested data from the last 20+ years