July 17, 2025 a 02:47 am


JNJ: Dividend Analysis - Johnson & Johnson
Johnson & Johnson remains a reliable dividend provider with a strong history of consistent dividend payments. Its robust financial standing and consistent dividend growth make it a favored choice for income-focused investors. Let's delve deeper into its dividend potential and examine the underlying factors contributing to its performance.
📊 Overview
Johnson & Johnson, encompassing a broad healthcare sector, continues to uphold its reputation as a prominent dividend contributor. The company boasts a commendable dividend yield of 3.28%, coupled with a substantial history of uninterrupted dividend increases for 56 consecutive years. The absence of recent dividend cuts underscores its commitment to shareholder returns.
| Metric | Value |
|---|---|
| Sector | Healthcare |
| Dividend yield | 3.28% |
| Current dividend per share | $4.91 |
| Dividend history | 56 years |
| Last cut or suspension | None |
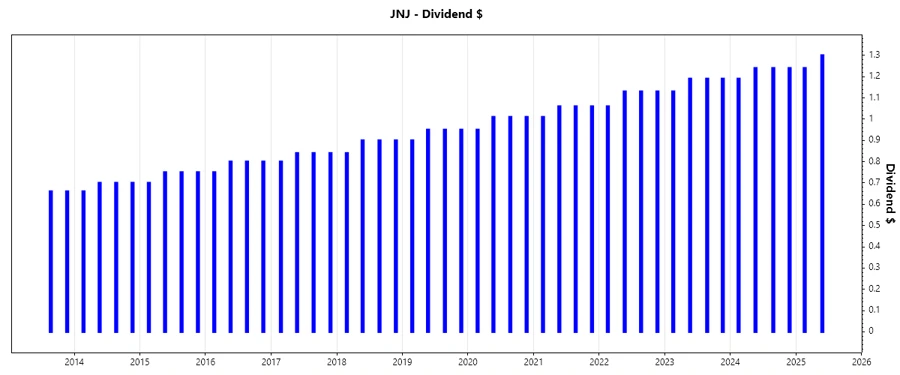
🗣️ Dividend History
The rich dividend history of Johnson & Johnson highlights its dedication to rewarding shareholders. The company's enduring record of paying dividends for 56 consecutive years serves as a testament to its financial health and operational stability.
| Year | Dividend per Share (USD) |
|---|---|
| 2025 | 2.54 |
| 2024 | 4.91 |
| 2023 | 4.70 |
| 2022 | 4.45 |
| 2021 | 4.19 |
📈 Dividend Growth
Analyzing the dividend growth rate serves as a vital indicator of an organization's capacity to enhance shareholder value. With Johnson & Johnson, dividend growth is evident over both the short and long term, reflecting strong cash flow management and earnings stability.
| Time | Growth |
|---|---|
| 3 years | 5.43% |
| 5 years | 5.54% |
The average dividend growth is 5.54% over 5 years. This shows moderate but steady dividend growth.
✅ Payout Ratio
Payout ratios help determine how sustainable a company's dividend payments are relative to its earnings and cash flows. Johnson & Johnson maintains a balanced payout ratio, which supports future increases in dividend payments while allowing for reinvestment in the business.
| Key figure | Ratio |
|---|---|
| EPS-based | 52.43% |
| Free cash flow-based | 63.62% |
The 52.43% EPS and 63.62% FCF payout ratios suggest a sustainable dividend policy, allowing for further growth and financial flexibility.
📉 Cashflow & Capital Efficiency
Insightful cash flow management and capital efficiency are indicative of a company's ability to internally fund its growth while sustaining dividends. Analyzing these metrics offers a glimpse into the company's operational strength and return potential.
| Year | 2022 | 2023 | 2024 |
|---|---|---|---|
| Free Cash Flow Yield | 3.72% | 4.60% | 5.75% |
| Earnings Yield | 3.89% | 8.85% | 4.08% |
| CAPEX to Operating Cash Flow | 18.92% | 19.93% | 18.23% |
| Stock-based Compensation to Revenue | 1.42% | 1.36% | 1.32% |
| Free Cash Flow / Operating Cash Flow Ratio | 81.08% | 80.07% | 81.77% |
The robust cash flow metrics coupled with efficient capital expenditures elucidate Johnson & Johnson's capability to maintain dividend payouts and optimal reinvestment in its enterprise.
⚠️ Balance Sheet & Leverage Analysis
A thorough analysis of Johnson & Johnson's balance sheet reveals prudent financial practices and cautious leverage management, ensuring long-term stability for investors.
| Year | 2022 | 2023 | 2024 |
|---|---|---|---|
| Debt-to-Equity | 51.61% | 42.65% | 51.24% |
| Debt-to-Assets | 21.16% | 17.51% | 20.34% |
| Debt-to-Capital | 34.04% | 29.90% | 33.88% |
| Net Debt to EBITDA | 1.01 | 0.32 | 0.51 |
| Current Ratio | 0.99 | 1.16 | 1.11 |
| Quick Ratio | 0.81 | 0.91 | 0.86 |
| Financial Leverage | 2.44 | 2.44 | 2.52 |
The comprehensive balance sheet metrics clearly depict Johnson & Johnson's adequacy in leveraging for growth with a disciplined approach to managing debts, ensuring stable and predictable financial health.
✅ Fundamental Strength & Profitability
Profitability and fundamental strength are key to assessing an organization's potential to achieve shareholder value consistently. Johnson & Johnson's impressive performance in these areas indicates robust operational strategies and profitability safeguards.
| Year | 2022 | 2023 | 2024 |
|---|---|---|---|
| Return on Equity | 23.36% | 51.11% | 19.68% |
| Return on Assets | 9.57% | 20.98% | 7.81% |
| Margins - Net | 22.43% | 41.28% | 15.84% |
| EBIT Margin | 24.55% | 18.59% | 19.64% |
| EBITDA Margin | 33.26% | 27.38% | 27.90% |
| Gross Margin | 69.25% | 68.82% | 69.07% |
| Research & Development to Revenue | 17.67% | 17.71% | 19.40% |
Through effective cost management and strategic investments in research and development, Johnson & Johnson demonstrates robust fundamental strengths essential for sustainable profitability.
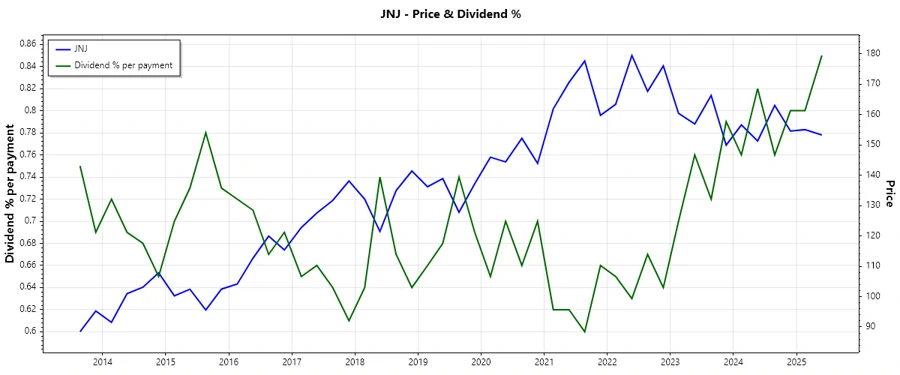
📈 Price Development
📊 Dividend Scoring System
| Criteria | Score | Visual |
|---|---|---|
| Dividend yield | 4/5 | |
| Dividend Stability | 5/5 | |
| Dividend Growth | 3/5 | |
| Payout Ratio | 4/5 | |
| Financial Stability | 4/5 | |
| Dividend Continuity | 5/5 | |
| Cashflow Coverage | 4/5 | |
| Balance Sheet Quality | 4/5 |
Total Score: 33/40
🗣️ Rating
Johnson & Johnson receives a robust dividend rating, underpinning its position as a secure investment for income seekers. Given its consistent dividend history, solid financial foundation, and careful payout strategies, it is a dependable choice for investors seeking stable income with potential for capital appreciation.
Smart Data Insight
Master the Perfect Entry & Exit for this Stock
Don't leave your profits to chance. Historically, this stock follows specific seasonal patterns that institutional traders use to maximize returns.
- ✅ Identify the "Golden Buying Window"
- ✅ Avoid high-risk correction cycles
- ✅ Backtested data from the last 20+ years