November 20, 2025 a 01:15 pm
JKHY: Trend and Support & Resistance Analysis - Jack Henry & Associates, Inc.
Jack Henry & Associates, Inc. (JKHY) has shown a notable trend in recent months amidst dynamic market conditions. As a leading provider of technology and payment processing services for financial organizations, the company's stock performance reflects its operational excellence. The analysis reveals current market trends and key support and resistance levels, crucial for both short-term trading strategies and long-term investment decisions.
Trend Analysis
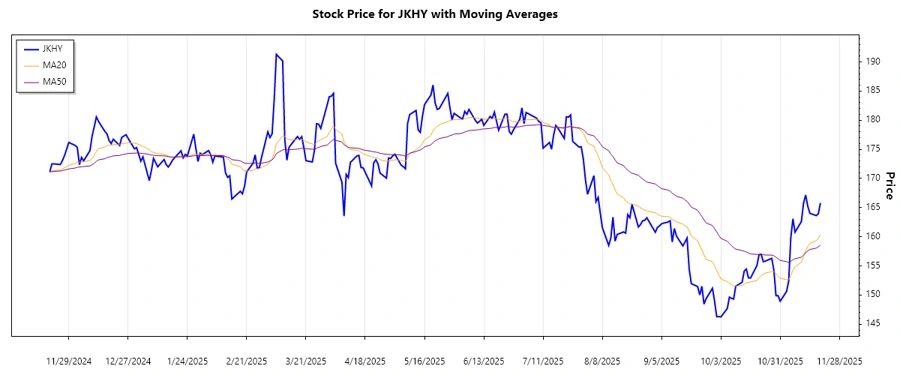
Recent data indicate a shifting trend in JKHY’s stock prices. Based on the calculated EMAs:
| Date | Closing Price | Trend |
|---|---|---|
| 2025-11-19 | $165.8 | ▲ Upward |
| 2025-11-18 | $163.94 | ▲ Upward |
| 2025-11-17 | $163.64 | ▲ Upward |
| 2025-11-14 | $164.02 | ▲ Upward |
| 2025-11-13 | $165.27 | ▲ Upward |
| 2025-11-12 | $167.17 | ▲ Upward |
| 2025-11-11 | $165.73 | ▲ Upward |
The EMA20 is consistently above the EMA50, signaling a strong upward trend. This indicates a bullish sentiment in the market for JKHY.
Support and Resistance
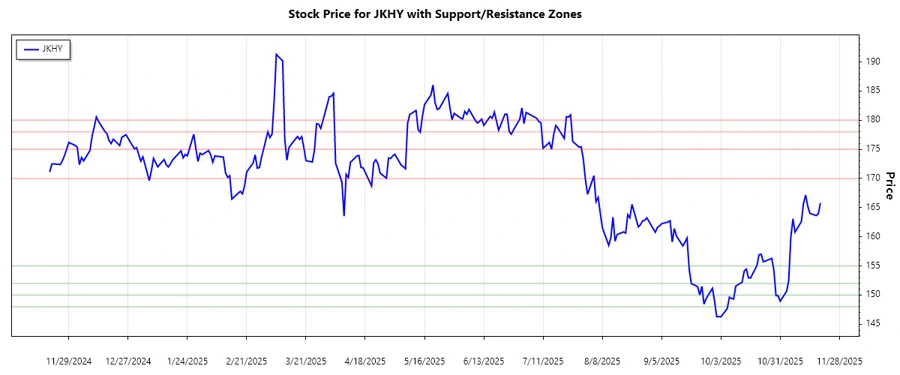
Identifying key support and resistance levels is crucial for strategic decisions:
| Zone | From | To |
|---|---|---|
| Support 1 | $148.00 | $150.00 |
| Support 2 | $152.00 | $155.00 |
| Resistance 1 | $170.00 | $175.00 |
| Resistance 2 | $178.00 | $180.00 |
The stock is currently trading near the second resistance zone, indicating potential consolidation or a breakout above this level.
Conclusion
JKHY demonstrates a robust upward trend supported by a consistent EMA pattern. The current position near resistance levels suggests potential for either a breakout or pullback, making it a critical point of observation for investors. While the opportunity for gains exists, caution is warranted due to proximity to resistance. Consequently, careful monitoring is advised for both traders and long-term investors to capitalize on potential opportunities.
Smart Data Insight
Master the Perfect Entry & Exit for this Stock
Don't leave your profits to chance. Historically, this stock follows specific seasonal patterns that institutional traders use to maximize returns.
- ✅ Identify the "Golden Buying Window"
- ✅ Avoid high-risk correction cycles
- ✅ Backtested data from the last 20+ years