
June 04, 2026 a 03:44 pm

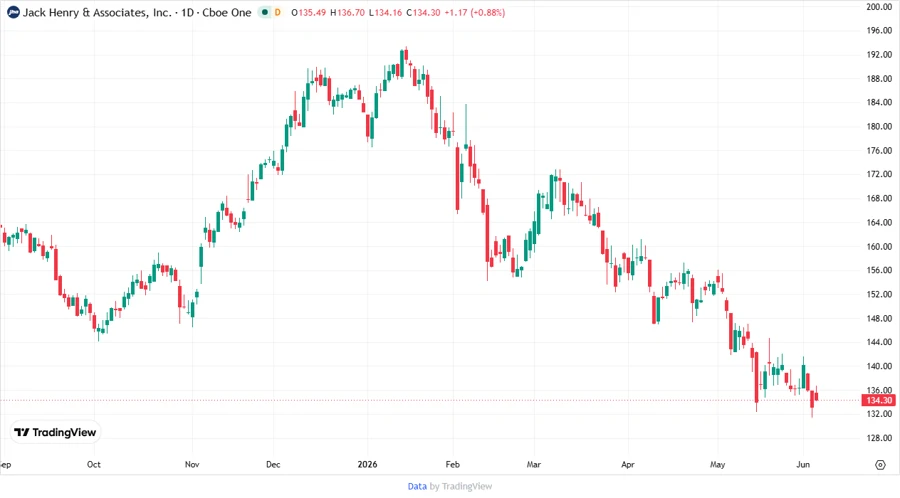
JKHY: Fundamental Ratio Analysis - Jack Henry & Associates, Inc.
Jack Henry & Associates, Inc. is a prominent player in technology solutions and payment processing services for financial services organizations. With a robust portfolio through brands like Jack Henry Banking and Symitar, the company has maintained strong financial health. Its diversified approach and adaptive product lineup positions it well in the competitive financial technology landscape.
Fundamental Rating
Jack Henry & Associates, Inc. exhibits a strong financial position with a solid overall score reflecting its stable economic performance.
| Category | Score | Visualization |
|---|---|---|
| Discounted Cash Flow | 4 | |
| Return on Equity | 5 | |
| Return on Assets | 5 | |
| Debt to Equity | 4 | |
| Price to Earnings | 2 | |
| Price to Book | 2 |
Historical Rating
The historical performance shows consistency in financial metrics, indicating reliability and robust performance over time.
| Date | Overall | DCF | ROE | ROA | Debt/Equity | P/E | P/B |
|---|---|---|---|---|---|---|---|
| 2026-06-03 | 4 | 4 | 5 | 5 | 4 | 2 | 2 |
| Previous | 4 | 5 | 5 | 4 | 2 | 2 |
Analyst Price Targets
Analysts offer a positive outlook with the majority predicting an upward trend in stock value, marking it as a promising investment option.
| High | Low | Median | Consensus |
|---|---|---|---|
| $220 | $165 | $200.5 | $194.63 |
Analysts' Sentiment
Analysts hold a favorable view with a majority recommending it as a Buy, highlighting positive market expectations.
| Recommendation | Count | Distribution |
|---|---|---|
| Strong Buy | 0 | |
| Buy | 12 | |
| Hold | 10 | |
| Sell | 0 | |
| Strong Sell | 0 |
Conclusion
Jack Henry & Associates, Inc. demonstrates considerable strengths in financial stability and future growth potential, making it a compelling choice for investors. Its robust performance across key metrics underpins its enduring market presence. The positive analyst sentiment further reinforces its standing as a reliable investment. However, it faces competition in the technology service sector that could impact long-term growth. Overall, it remains a promising stock with a well-rounded outlook.
Smart Data Insight
Master the Perfect Entry & Exit for this Stock
Don't leave your profits to chance. Historically, this stock follows specific seasonal patterns that institutional traders use to maximize returns.
- ✅ Identify the "Golden Buying Window"
- ✅ Avoid high-risk correction cycles
- ✅ Backtested data from the last 20+ years