
September 04, 2025 a 03:43 pm

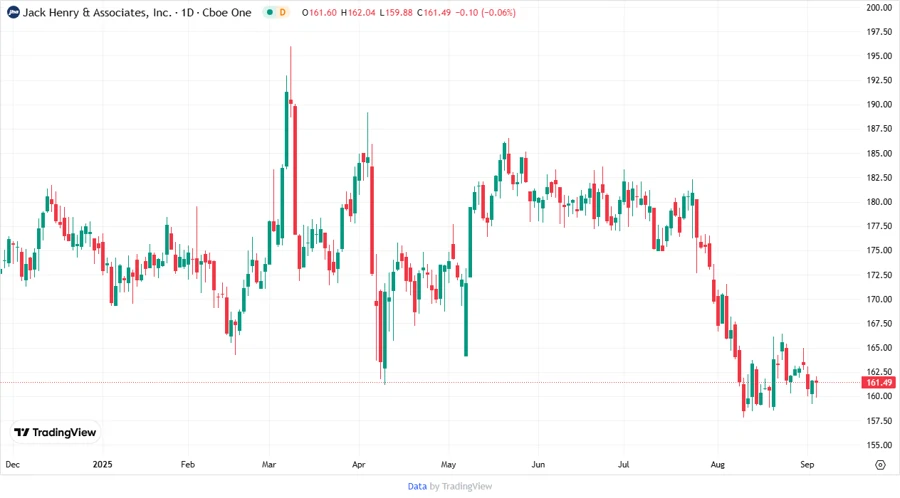
JKHY: Fundamental Ratio Analysis - Jack Henry & Associates, Inc.
Jack Henry & Associates, Inc. provides essential technology and payment processing solutions for financial services, showcasing a stable operational model. With a focus on innovative products and services tailored for banks and credit unions, JKHY's diversified offerings ensure its resilience in a dynamic market environment.
Fundamental Rating
The fundamental health of Jack Henry & Associates showcases a balanced performance across key financial metrics. Below are the evaluation categories with their respective scores.
| Category | Score | Bar |
|---|---|---|
| Discounted Cash Flow | 3 | |
| Return On Equity | 5 | |
| Return On Assets | 5 | |
| Debt To Equity | 1 | |
| Price To Earnings | 2 | |
| Price To Book | 1 |
Historical Rating
Looking at the historical scores, there is a consistent trend over time indicating steady performance metrics for JKHY.
| Date | Overall | DCF | ROE | ROA | Debt/Equity | P/E | P/B |
|---|---|---|---|---|---|---|---|
| 2025-09-03 | 3 | 3 | 5 | 5 | 1 | 2 | 1 |
| Previous | 0 | 3 | 5 | 5 | 1 | 2 | 1 |
Analyst Price Targets
Analyst consensus reflects a firm price target with no significant variance, highlighting a stable market perspective towards JKHY.
| High | Low | Median | Consensus |
|---|---|---|---|
| 204 | 204 | 204 | 204 |
Analyst Sentiment
The analyst sentiment positions JKHY as predominantly a "Hold", supported by a larger number of buy recommendations compared to sells.
| Recommendation | Count | Bar |
|---|---|---|
| Strong Buy | 0 | |
| Buy | 9 | |
| Hold | 11 | |
| Sell | 1 | |
| Strong Sell | 0 |
Conclusion
Jack Henry & Associates, Inc. demonstrates robust business fundamentals with competitive strengths in technology solutions and payment processing. Its solid performance in key financial metrics indicates resilience, although a high debt-to-equity ratio signals some leverage issues. Analyst sentiment leans towards a neutral hold, with stable price targets affirming market confidence. While growth opportunities in digital transformation are promising, potential risks from economic fluctuations and sector competition should be monitored.
Smart Data Insight
Master the Perfect Entry & Exit for this Stock
Don't leave your profits to chance. Historically, this stock follows specific seasonal patterns that institutional traders use to maximize returns.
- ✅ Identify the "Golden Buying Window"
- ✅ Avoid high-risk correction cycles
- ✅ Backtested data from the last 20+ years