August 03, 2025 a 01:01 pm

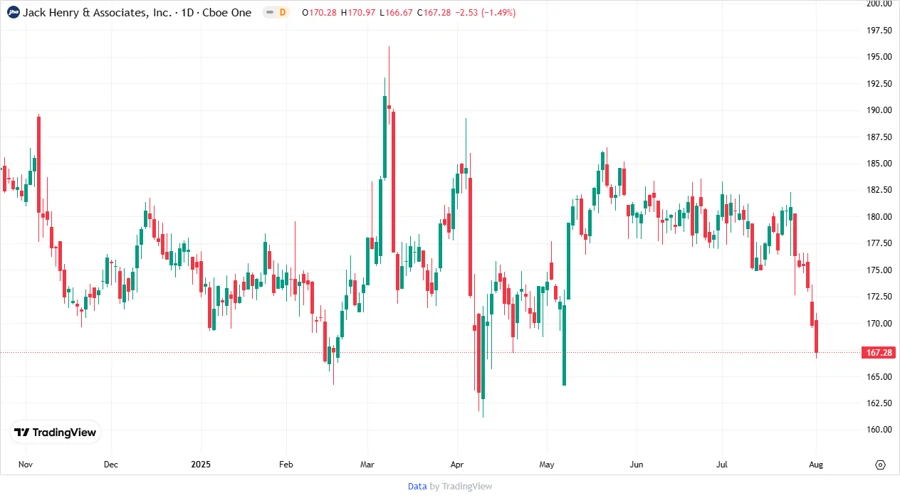
JKHY: Fundamental Ratio Analysis - Jack Henry & Associates, Inc.
Jack Henry & Associates, Inc. is a key player in the technology solutions and payment processing services industry, catering primarily to financial institutions. With a diversified business model across various segments, it offers robust solutions for banks and credit unions, alongside digital and payment solutions.
Fundamental Rating
Jack Henry's current fundamental ratings indicate a solid performance in key areas such as return on assets and equity, though there is room for improvement in valuation metrics like price-to-earnings and price-to-book ratios.
| Category | Score | Visualization |
|---|---|---|
| Discounted Cash Flow | 3 | |
| Return on Equity | 4 | |
| Return on Assets | 5 | |
| Debt to Equity | 3 | |
| Price to Earnings | 2 | |
| Price to Book | 2 |
Historical Rating
The historical scores demonstrate stability in key performance metrics while revealing the consistency of the company's fundamental strength over time.
| Date | Overall Score | DCF | ROE | ROA | D/E | P/E | P/B |
|---|---|---|---|---|---|---|---|
| 2025-08-01 | 3 | 3 | 4 | 5 | 3 | 2 | 2 |
| Previous | 0 | 3 | 4 | 5 | 3 | 2 | 2 |
Analyst Price Targets
Analysts set varied price targets indicating mixed views, with a median target suggesting moderate growth potential.
| High | Low | Median | Consensus |
|---|---|---|---|
| 206 | 180 | 193 | 191.8 |
Analyst Sentiment
Analyst sentiment is mostly neutral, with the majority recommending to hold, reflecting a cautious stance towards potential investments.
| Recommendation | Count | Visualization |
|---|---|---|
| Strong Buy | 0 | |
| Buy | 9 | |
| Hold | 11 | |
| Sell | 1 | |
| Strong Sell | 0 |
Conclusion
Jack Henry & Associates, Inc. exhibits a stable performance backed by solid fundamental scores, particularly in profitability. However, valuation challenges remain a concern with lower price-to-earnings expectations. Analysts suggest holding the stock, reflecting uncertainty about growth potential. The company’s strong operational framework and wide service offering are advantageous, but navigating market volatility and evolving technological landscapes pose risks.
Smart Data Insight
Master the Perfect Entry & Exit for this Stock
Don't leave your profits to chance. Historically, this stock follows specific seasonal patterns that institutional traders use to maximize returns.
- ✅ Identify the "Golden Buying Window"
- ✅ Avoid high-risk correction cycles
- ✅ Backtested data from the last 20+ years