
July 18, 2026 a 05:15 am
JKHY: Fibonacci Analysis - Jack Henry & Associates, Inc.
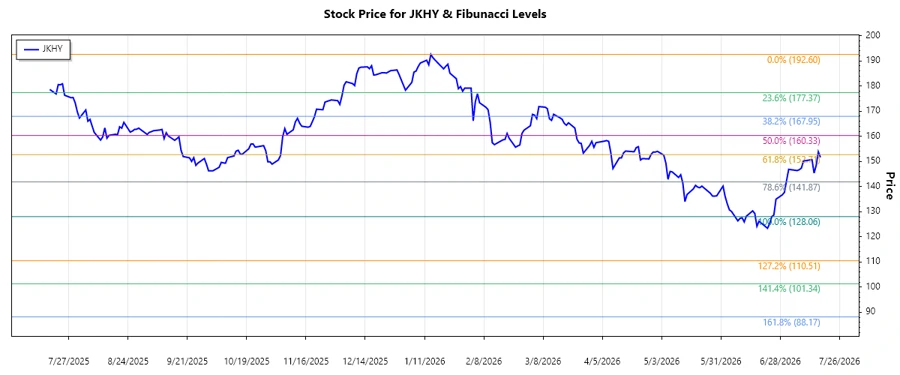
Jack Henry & Associates, Inc. has shown a declining trend in recent months. As a financial technology company, JKHY is technically positioned at an interesting point. Recent movements suggest opportunities for both short-term traders due to potential support levels and long-term investors focusing on the company's strategic business segments.
Fibonacci Analysis
| Aspect | Details |
|---|---|
| Trend Duration | January 14, 2026 - July 17, 2026 |
| High Point | $192.60 on January 14, 2026 |
| Low Point | $128.06 on June 24, 2026 |
| Fibonacci Level 0.236 | $142.65 |
| Fibonacci Level 0.382 | $151.24 |
| Fibonacci Level 0.5 | $160.33 |
| Fibonacci Level 0.618 | $169.42 |
| Fibonacci Level 0.786 | $181.03 |
| Current Level | The current price of $151.67 is within the 0.382 retracement zone. |
| Technical Interpretation | The present retracement level offers a temporary support zone, and a significant upward or downward movement might define upcoming resistance or support areas. |
Conclusion
The technical analysis of Jack Henry & Associates, Inc. reveals a recent downtrend from high to low, adjusting from $192.60 to $128.06. Currently positioned within the 0.382 Fibonacci retracement level, there is potential for upward momentum as a key support holds. Yet, vigilance is advised as a further dip below can accelerate bearish sentiments. With its financial technology sector's inherent volatility, traders must weigh in both the potential of support holding versus the risk of further decline. Strategic financial positioning within its diverse segments could be pivotal as it navigates these technical levels, offering a mixed outlook for investors.
Smart Data Insight
Master the Perfect Entry & Exit for this Stock
Don't leave your profits to chance. Historically, this stock follows specific seasonal patterns that institutional traders use to maximize returns.
- ✅ Identify the "Golden Buying Window"
- ✅ Avoid high-risk correction cycles
- ✅ Backtested data from the last 20+ years