February 28, 2026 a 10:15 am
JKHY: Fibonacci Analysis - Jack Henry & Associates, Inc.
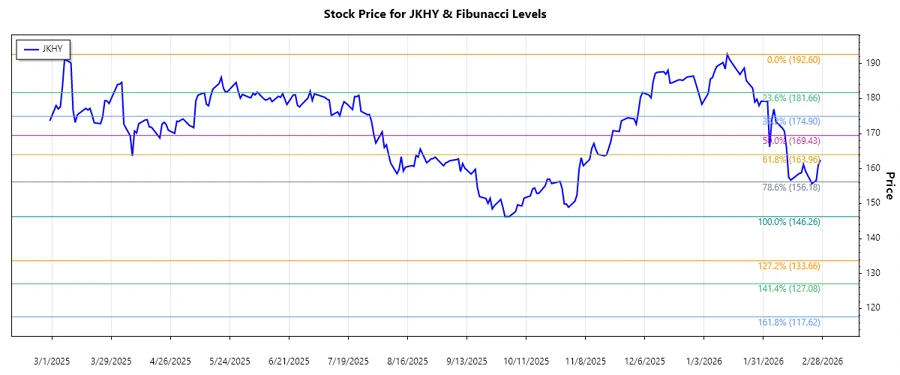
Jack Henry & Associates, Inc. provides technology solutions crucial for financial services organizations in the U.S. The period analyzed indicates a dominant downtrend, reflecting a decrease in investor sentiment. This analysis examines the potential reversal points and strength of the trend using Fibonacci levels. It's essential for investors to evaluate these levels as potential support or resistance in upcoming trading sessions.
Fibonacci Analysis
| Trend Detail | Value |
|---|---|
| Start Date | 2025-08-06 |
| End Date | 2026-02-27 |
| High Price | $192.6 (2026-01-14) |
| Low Price | $146.26 (2025-10-03) |
| Fibonacci Level | Price Level |
|---|---|
| 0.236 | $159.32 |
| 0.382 | $166.15 |
| 0.5 | $169.43 |
| 0.618 | $172.70 |
| 0.786 | $178.04 |
The current price is $162.46, indicating it's within the 0.236 and 0.382 retracement zone. These levels suggest potential support zones, where a price rebound might occur.
Technically, these Fibonacci levels can serve as support, with the 0.236 level already corroborated by the close proximity of the current price. If the downward momentum persists, traders should be cautious of breaching these levels.
Conclusion
Jack Henry & Associates, Inc.'s technical outlook currently depicts a bearish trend within a significant correction phase. While the current price is in the lower ranges of Fibonacci retracement, which could act as a support, investors are advised to watch these levels closely. A break below could potentially signal further downside. However, a bounce back provides a chance for traders looking for a short-term gain. Cautious optimism is advised as external economic factors could significantly impact future trends. Technically, monitoring these levels will be instrumental in making informed trading decisions.