October 20, 2025 a 06:44 am
JKHY: Fibonacci Analysis - Jack Henry & Associates, Inc.
Jack Henry & Associates, Inc. (JKHY) has experienced a significant downward trend over the past few months, indicating potential selling pressure in the market. As a prominent player in providing technology solutions and payment processing services to financial institutions, the company's stock movement is crucial for investors. Monitoring retracement levels can offer insights into potential support zones for JKHY's stock.
Fibonacci Analysis
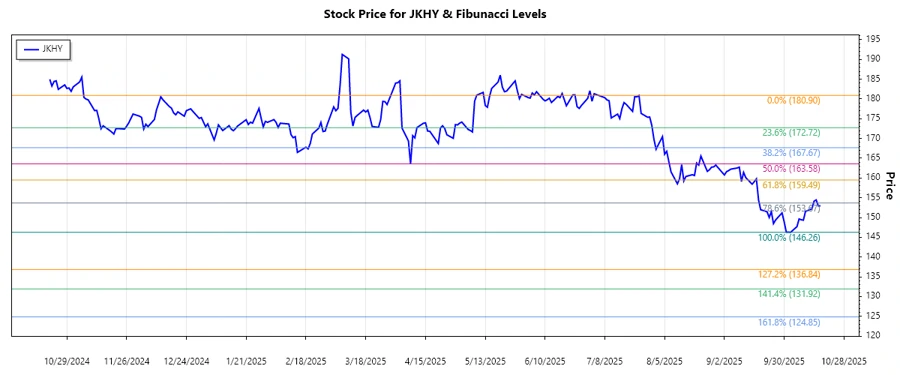
Upon examining the latest data, Jack Henry & Associates, Inc. (JKHY) exhibited a clear downward trend from early July 2025 to mid-October 2025, with the price decreasing from a high of $180.9 to a low of $146.26. Using these points, the Fibonacci retracement levels were calculated as follows:
| Fibonacci Level | Price Level |
|---|---|
| 0.236 | $153.75 |
| 0.382 | $158.74 |
| 0.5 | $163.58 |
| 0.618 | $168.42 |
| 0.786 | $174.08 |
Currently, the stock price (@$152.93) is hovering just below the 0.236 Fibonacci level, indicating a potential support zone. If the stock remains above this level, it may suggest a corrective move towards higher retracement levels. Given the recent price movement, this level could act as a strong support, preventing further declines.
Conclusion
Overall, Jack Henry & Associates, Inc. (JKHY) is facing downward pressure, yet retracement levels provide optimism for potential rebounds. Investors should closely monitor the 0.236 Fibonacci level as it may offer support. Risks include further declines below $146.26 if bearish momentum persists. On the upside, overcoming higher retracement levels could signal a reversal of the current downtrend, presenting opportunities for a bullish stance.
Smart Data Insight
Master the Perfect Entry & Exit for this Stock
Don't leave your profits to chance. Historically, this stock follows specific seasonal patterns that institutional traders use to maximize returns.
- ✅ Identify the "Golden Buying Window"
- ✅ Avoid high-risk correction cycles
- ✅ Backtested data from the last 20+ years