December 10, 2025 a 03:31 am

JKHY: Dividend Analysis - Jack Henry & Associates, Inc.
📊 Jack Henry & Associates, Inc., a financial software and payment processing company, showcases a stable dividend history with consistent growth over the past decades. With a current dividend yield of 1.34%, the stock provides moderate income potential. The company’s solid payout ratios and robust financial health complement its attractive dividends, making it a compelling investment option for income-focused investors.
Overview
Jack Henry & Associates operates within a stable industry sector and provides long-term dividend growth potential. Despite a moderate dividend yield, the company’s commitment to maintaining an uninterrupted dividend streak over 36 years signifies resilience and investor confidence.
| Metric | Value |
|---|---|
| Sector | Technology |
| Dividend yield | 1.34 % |
| Current dividend per share | $2.25 |
| Dividend history | 36 years |
| Last cut or suspension | 1993 |
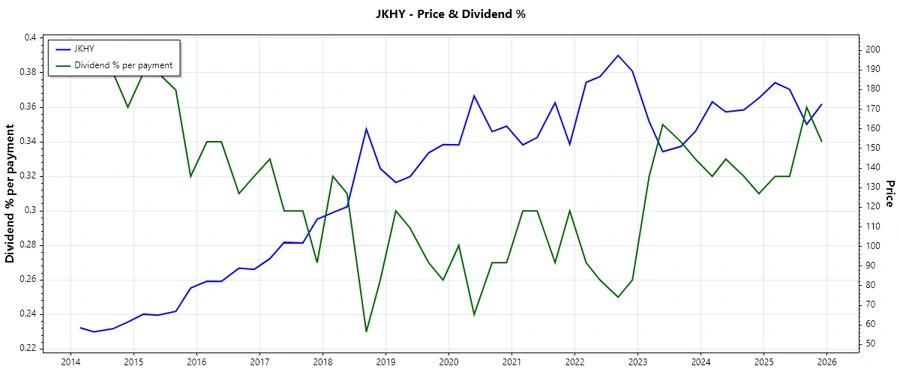
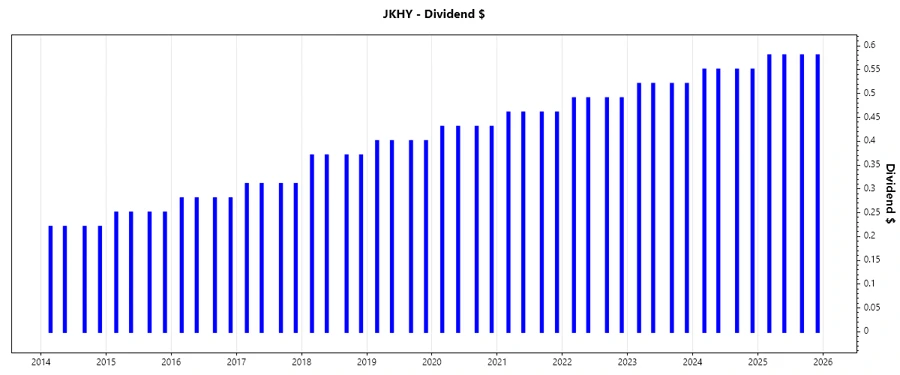
Dividend History
🗣️ The historical consistency in dividend payouts serves as a testament to the company’s strong operational performance and effective capital management. With its previous cut back in 1993, Jack Henry has demonstrated an impressive ability to provide reliable returns for shareholders.
| Year | Dividend per Share (USD) |
|---|---|
| 2025 | 2.32 |
| 2024 | 2.20 |
| 2023 | 2.08 |
| 2022 | 1.96 |
| 2021 | 1.84 |
Dividend Growth
📈 The dividend growth rates from Jack Henry elucidate moderate but consistent enhancement in shareholder returns. Over the past 3 and 5 years, growth metrics suggest a strategic focus on increasing payouts aligned with earnings outcomes.
| Time | Growth |
|---|---|
| 3 years | 6.14 % |
| 5 years | 6.58 % |
The average dividend growth is 6.58 % over 5 years. This shows moderate but steady dividend growth.
Payout Ratio
✅ Analyzing payout ratios highlights the sustainability of dividend distributions relative to earnings and free cash flow. Both the EPS-based and FCF-based ratios are within healthy thresholds, implying adequate financial leeway for maintaining or even enhancing dividend payouts.
| Key Figure | Ratio |
|---|---|
| EPS-based | 34.20 % |
| Free cash flow-based | 27.56 % |
The ratios suggest the company's dividends are comfortably supported by earnings and cash flow, mitigating any immediate risks of dividend cuts.
Cashflow & Capital Efficiency
📊 The examination of cash flow and capital efficiency metrics underscores Jack Henry’s proficiency in optimizing operational cash generation and prudent capital expenditure management. This is integral for sustaining dividend payments while pursuing growth investments.
| Metric | 2025 | 2024 | 2023 |
|---|---|---|---|
| Free Cash Flow Yield | 4.47% | 4.28% | 2.81% |
| Earnings Yield | 3.46% | 3.21% | 3.00% |
| CAPEX to Operating Cash Flow | 7.66% | 10.23% | 10.27% |
| Stock-based Compensation to Revenue | 1.20% | 1.30% | 1.38% |
| Free Cash Flow / Operating Cash Flow Ratio | 91.68% | 89.77% | 89.73% |
The company shows robust cash flow efficiency, with FCF consistently representing a high proportion of operating cash flows, thus enhancing dividend security.
Balance Sheet & Leverage Analysis
📉 A meticulous examination of the balance sheet affirms Jack Henry's strength in maintaining low debt levels and high liquidity, critical components in upholding dividend perseverance during economic downturns.
| Metric | 2025 | 2024 | 2023 |
|---|---|---|---|
| Debt-to-Equity | 0.00 | 0.00 | 0.08 |
| Debt-to-Assets | 0.00 | 0.00 | 0.05 |
| Debt-to-Capital | 0.00 | 0.00 | 0.08 |
| Net Debt to EBITDA | -0.127 | -0.143 | 0.164 |
| Current Ratio | 1.27 | 1.27 | 1.0 |
| Quick Ratio | 1.27 | 1.27 | 1.0 |
| Financial Leverage | 1.43 | 1.43 | 1.59 |
Strong liquidity ratios and a low leverage level underpin Jack Henry's ability to withstand economic pressures while keeping dividend commitments.
Fundamental Strength & Profitability
✅ Exceptional fundamentals confirm the company's capability to generate solid returns on equity and assets, further bolstered by healthy profit margins and reinvestment into R&D, affirming sustainable long-term growth.
| Metric | 2025 | 2024 | 2023 |
|---|---|---|---|
| Return on Equity | 21.39% | 17.92% | 19.90% |
| Return on Assets | 14.97% | 12.54% | 12.54% |
| Margins: Net | 19.19% | 17.23% | 17.65% |
| EBIT | 25.11% | 23.22% | 23.57% |
| EBITDA | 33.73% | 32.24% | 32.75% |
| Gross | 42.71% | 41.35% | 41.33% |
| Research & Development to Revenue | 6.85% | 6.69% | 6.87% |
Jack Henry & Associates exhibits durable profitability and a proactive approach to innovation investment, ensuring competitive superiority.
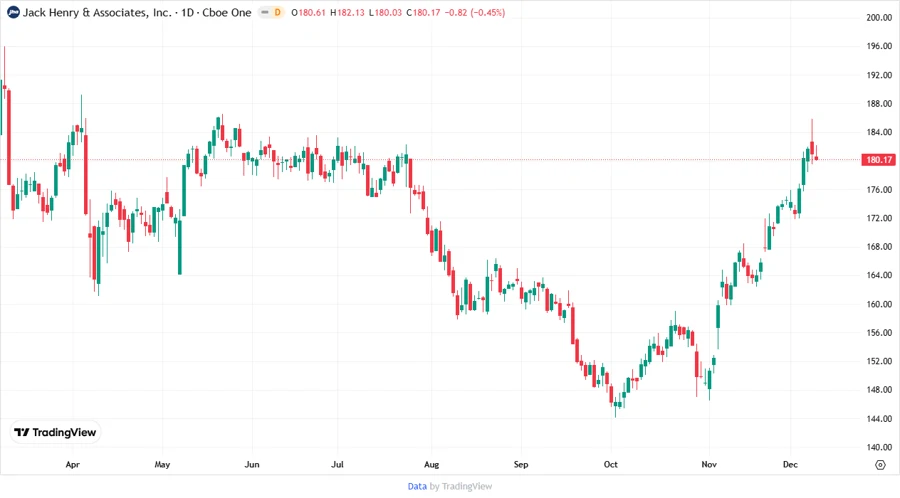
Price Development
Dividend Scoring System
| Category | Score | Visualization |
|---|---|---|
| Dividend yield | 3 | |
| Dividend Stability | 5 | |
| Dividend growth | 4 | |
| Payout ratio | 5 | |
| Financial stability | 5 | |
| Dividend continuity | 5 | |
| Cashflow Coverage | 5 | |
| Balance Sheet Quality | 4 |
Total Score: 36/40
Rating
The comprehensive financial and dividend analysis of Jack Henry & Associates, Inc. positions it as a robust candidate for income-focused portfolios. Its high stability and growth metrics, underscored by prudent financial management, render it a sound long-term investment with reliable dividend payouts. The overall rating is highly favorable.