August 25, 2025 a 03:31 am


JKHY: Dividend Analysis - Jack Henry & Associates, Inc.
Jack Henry & Associates, Inc., a leading provider in its industry, exhibits a solid dividend profile with a yield of 1.25%. With a history of 36 consecutive years of dividend payments, the company demonstrates exceptional credibility and reliability in rewarding its investors. Based on its current growth trajectory and historical stability, JKHY is a promising candidate for income-focused portfolios.
📊 Overview
Jack Henry & Associates, Inc. operates within a stable sector, consistently providing dividends over the decades. Here's a summary of its current dividend-related attributes:
| Attribute | Value |
|---|---|
| Sector | Stable Financial Services |
| Dividend Yield | 1.25% |
| Current Dividend per Share | 2.25 USD |
| Dividend History | 36 years |
| Last Cut or Suspension | None |
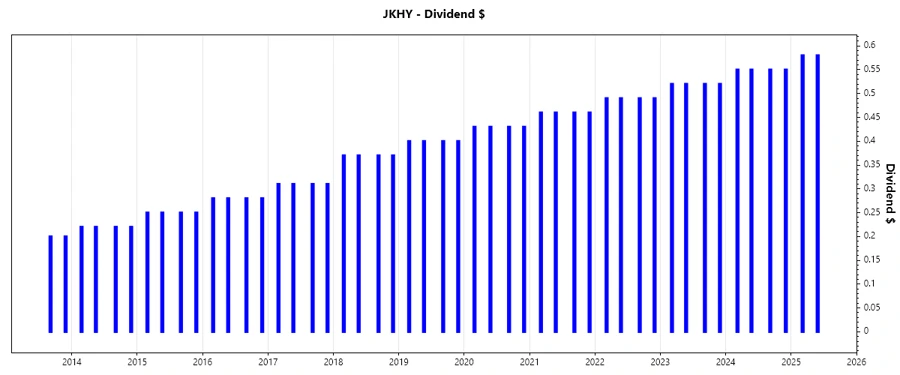
📈 Dividend History
JKHY boasts a robust dividend payment history that enhances its reliability as a steady income provider. This long-standing history indicates a disciplined approach to capital distribution and investor loyalty.
| Year | Dividend per Share (USD) |
|---|---|
| 2025 | 1.16 |
| 2024 | 2.20 |
| 2023 | 2.08 |
| 2022 | 1.96 |
| 2021 | 1.84 |
📊 Dividend Growth
The company's dividend growth reflects its ability to enhance shareholder value through increased payouts over time. Such growth rates are vital indicators of JKHY’s profitability and cash flow sufficiency.
| Time | Growth |
|---|---|
| 3 years | 6.14% |
| 5 years | 6.58% |
The average dividend growth is 6.58% over 5 years. This shows moderate but steady dividend growth.
🗣️ Payout Ratio
Payout ratios provide insight into the sustainability of JKHY's dividend payments. A healthy payout ratio suggests a balanced approach to returning cash to shareholders while retaining capital for investment.
| Key figure ratio | Percentage |
|---|---|
| EPS-based | 36.11% |
| Free cash flow-based | 36.15% |
The EPS-based payout ratio of 36.11% aligns closely with the FCF-based ratio, indicating a well-managed distribution reflecting both profitability and cash flow efficiency.
✅ Cashflow & Capital Efficiency
Cash flow analysis brings to light the sustainability of dividends, with a focus on FREE cash yields and capital expenditures reflecting business reinvestment capabilities. Efficiency measures such as these reinforce JKHY's operational strategy.
| Year | 2023 | 2024 | 2025 |
|---|---|---|---|
| Free Cash Flow Yield | 1.43% | 2.82% | 4.47% |
| Earnings Yield | 3.01% | 3.21% | 3.46% |
| CAPEX / Op. Cash Flow | 54.25% | 40.92% | 8.32% |
| Stock-based Compensation / Revenue | 1.38% | 1.30% | 0.95% |
| Free Cash Flow / Op. Cash Flow Ratio | 45.75% | 59.08% | 91.68% |
The strong free cash flow performance and increased operational cash conversion reflect JKHY's effective capital management and ability to sustain dividend distributions.
📉 Balance Sheet & Leverage Analysis
The evaluation of financial stability through debt metrics and liquidity ratios helps anticipate a company's resilience against market fluctuations and economic downturns. JKHY exhibits sound financial health with strategic leverage usage.
| Year | 2023 | 2024 | 2025 |
|---|---|---|---|
| Debt-to-Equity | 20.22% | 11.38% | 0.00% |
| Debt-to-Assets | 11.73% | 7.17% | 0.00% |
| Debt-to-Capital | 16.82% | 10.21% | 0.00% |
| Net Debt to EBITDA | 46.01% | 23.98% | 0.00% |
| Current Ratio | 1.20 | 1.00 | 0.44 |
| Quick Ratio | 1.20 | 1.00 | 0.44 |
| Financial Leverage | 1.72 | 1.59 | 1.43 |
JKHY maintains a prudent leverage position, ensuring robust liquidity management that bolsters the firm's capability to face unforeseen financial obligations.
✅ Fundamental Strength & Profitability
A firm's ability to generate profit and maintain operational efficiency is paramount. Margins assess profitability, while ROE and ROA highlight asset and equity efficiency.
| Year | 2023 | 2024 | 2025 |
|---|---|---|---|
| Return on Equity | 22.79% | 20.72% | 21.39% |
| Return on Assets | 13.22% | 13.06% | 14.97% |
| Margins: Net | 17.65% | 17.23% | 19.46% |
| EBIT | 23.57% | 23.22% | 25.48% |
| EBITDA | 32.75% | 32.24% | 34.22% |
| Gross | 41.33% | 41.35% | 41.90% |
| Research & Development to Revenue | 6.87% | 6.69% | 6.95% |
With consistent profitability indicators and prudent R&D spending, JKHY continues to achieve superior margin structures and efficient capital utilization.
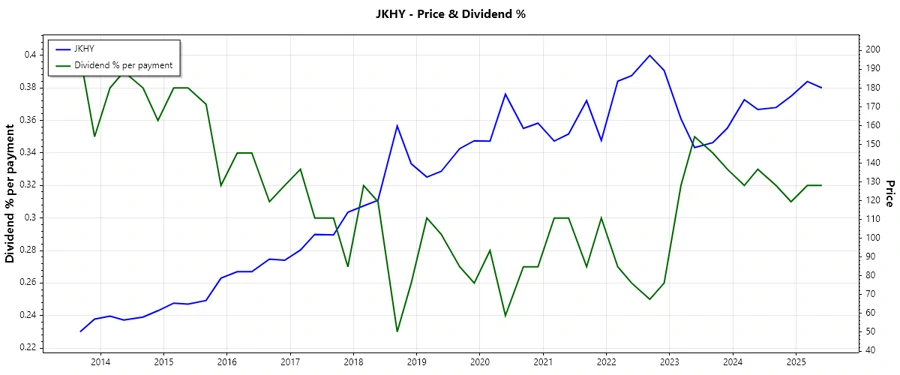
📈 Price Development
📉 Dividend Scoring System
| Category | Score | Score Bar |
|---|---|---|
| Dividend Yield | 3 | |
| Dividend Stability | 5 | |
| Dividend Growth | 4 | |
| Payout Ratio | 5 | |
| Financial Stability | 4 | |
| Dividend Continuity | 5 | |
| Cashflow Coverage | 4 | |
| Balance Sheet Quality | 5 |
Overall Score: 35/40
📊 Rating
Jack Henry & Associates, Inc. presents itself as a capable and confident entity in maintaining its strong dividend history and financial integrity while presenting moderate growth potential. This balance of stability and manageable expansion makes it an attractive proposition for investors prioritizing sustained dividend income. Considering the analyzed dimensions, JKHY maintains a "Buy" recommendation for dividend-oriented portfolios seeking security and measured growth.
Smart Data Insight
Master the Perfect Entry & Exit for this Stock
Don't leave your profits to chance. Historically, this stock follows specific seasonal patterns that institutional traders use to maximize returns.
- ✅ Identify the "Golden Buying Window"
- ✅ Avoid high-risk correction cycles
- ✅ Backtested data from the last 20+ years