March 17, 2026 a 04:03 am
JBHT: Trend and Support & Resistance Analysis - J.B. Hunt Transport Services, Inc.
The J.B. Hunt Transport Services, Inc. stock has demonstrated significant movements over the past few months. The current analysis aims to explore the prevailing trend and identify key support and resistance zones using a technical approach. Understanding these trends may provide valuable insights for investors considering the stock within their portfolios.
Trend Analysis
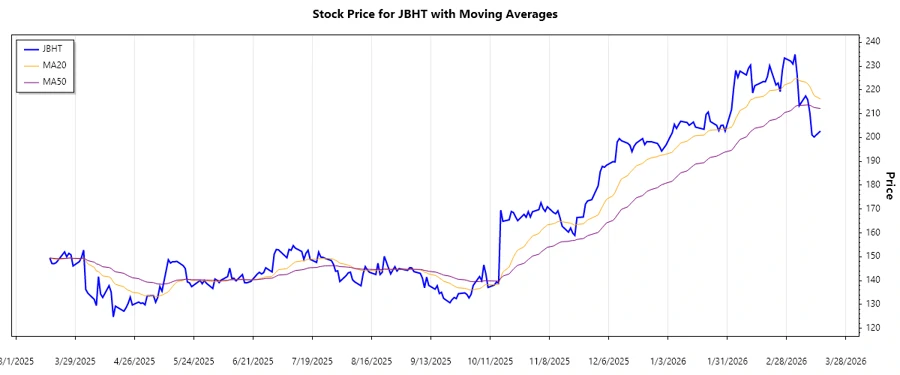
The recent price data and calculated EMAs indicate a dominant trend in J.B. Hunt Transport Services, Inc.
Given the calculations, we observe:
| Date | Close Price | Trend |
|---|---|---|
| 2026-03-16 | 202.73 | ▼ |
| 2026-03-13 | 200.25 | ▼ |
| 2026-03-12 | 201.13 | ▼ |
| 2026-03-11 | 210.36 | ▲ |
| 2026-03-10 | 215.85 | ▲ |
| 2026-03-09 | 217.46 | ▲ |
| 2026-03-06 | 213.39 | ▲ |
The EMAs suggest a downward trend as the EMA20 is below the EMA50, indicating that JBHT is experiencing temporary bearish momentum.
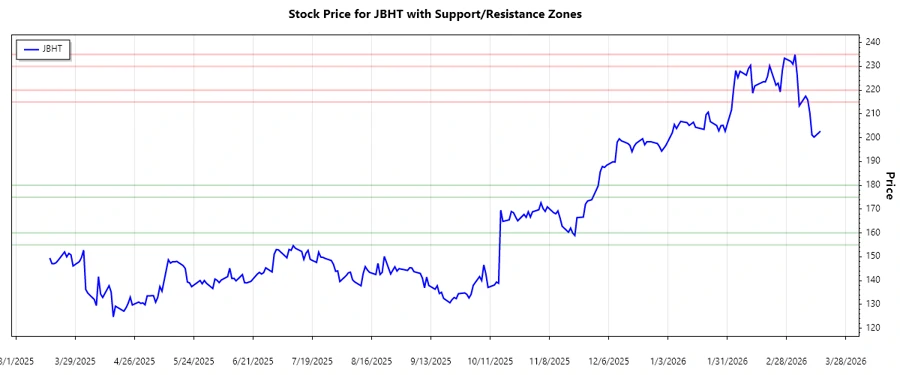
Support and Resistance
Analyzed data reveals key support and resistance zones for JBHT stock.
| Zone Type | From | To |
|---|---|---|
| Support | 155.00 | 160.00 |
| Support | 175.00 | 180.00 |
| Resistance | 215.00 | 220.00 |
| Resistance | 230.00 | 235.00 |
The current price suggests that JBHT is approaching a resistance zone, hinting at potential selling pressure upon reaching these levels.
J.B. Hunt Transport Services, Inc. shows signs of bearish momentum in the short term, yet remains in proximity to significant resistance zones. These factors suggest potential short-term setbacks, but also opportunities for long-term positioning. Market participants should remain vigilant of developments that could impact these technical levels. Careful tracking and analysis are advised to time entry or exit points effectively.