January 10, 2026 a 02:03 pm

JBHT: Trend and Support & Resistance Analysis - J.B. Hunt Transport Services, Inc.
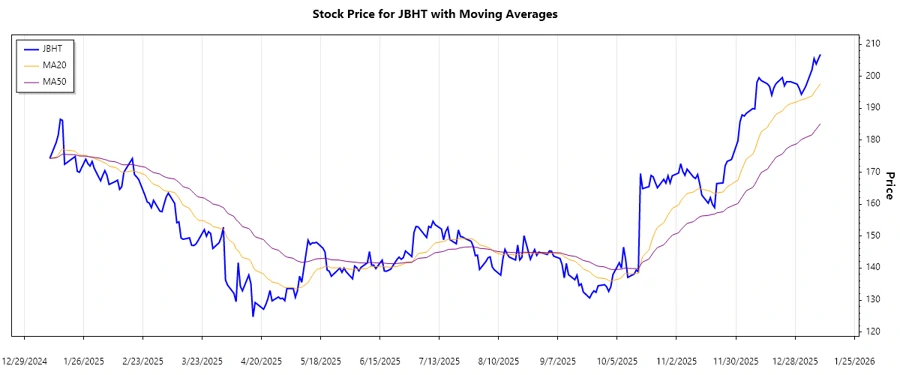
J.B. Hunt Transport Services, Inc. has shown a dynamic market performance characterized by significant price fluctuations in the past months. The stock has been influenced by market conditions and company dynamics, leading to observable trends and key price zones. Investors should be mindful of these patterns as they can aid in making informed investment decisions. Technical indicators such as EMA are crucial for determining the trend direction and understanding potential support and resistance zones.
Trend Analysis
| Date | Closing Price | Trend |
|---|---|---|
| 2026-01-09 | 206.85 | ▲ |
| 2026-01-08 | 205.42 | ▲ |
| 2026-01-07 | 203.82 | ▲ |
| 2026-01-06 | 205.54 | ▲ |
| 2026-01-05 | 202.02 | ▼ |
| 2026-01-02 | 196.78 | ▼ |
| 2025-12-31 | 194.34 | ▼ |
The EMA20 is currently above the EMA50, indicating an upward trend. The tabla above highlights recent trends, with the majority displaying a strong upward momentum. This suggests potential bullish behavior in the coming days.
Support- and Resistance
| Zone Type | Price Range |
|---|---|
| Support | 185 - 190 |
| Support | 195 - 200 |
| Resistance | 210 - 215 |
| Resistance | 220 - 225 |
The current price is approaching the resistance zone of 210 - 215. This indicates that while there is resistance, breaking through could propel the stock into the next resistance level.
Conclusion
The stock of J.B. Hunt Transport Services, Inc. shows a strong upward trend, likely to continue if the resistance levels are breached. The support zones provide a strong base, reducing risk, while the resistance zones pose a challenge to ascending prices. Both opportunities and caution should be advised to traders and investors; however, the momentum appears chiefly bullish. Technical indicators provide valuable insights, underscoring the importance of continuous monitoring of market dynamics.