October 07, 2025 a 06:45 am
JBHT: Fibonacci Analysis - J.B. Hunt Transport Services, Inc.
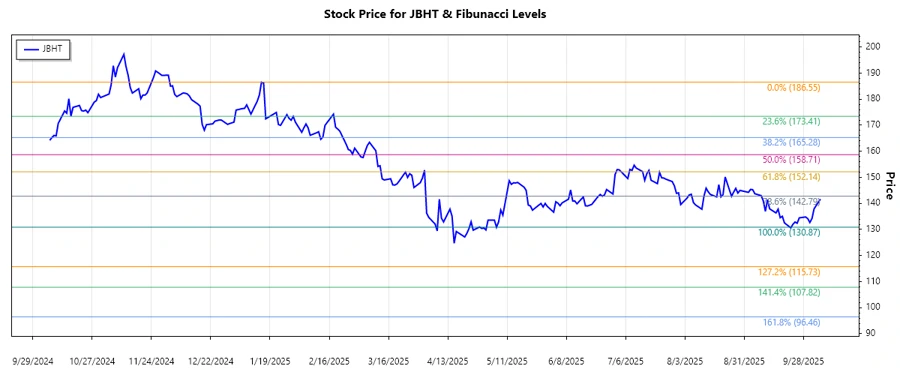
J.B. Hunt Transport Services, Inc. displays a distinct downward trend based on the recent data. The company's share has seen a significant drop from its earlier high levels over the months. This reflects possible market challenges or industry-specific headwinds affecting its stock performance. Despite offering comprehensive logistics solutions across North America, investor sentiment seems cautious. Technical analysis suggests careful consideration before taking any actions.
Fibonacci Analysis
| Analysis Aspect | Details |
|---|---|
| Trend Period | January 16, 2025 to October 6, 2025 |
| High Point | $186.55 on January 15, 2025 |
| Low Point | $130.87 on May 6, 2025 |
Fibonacci Retracement Levels
| Level | Price |
|---|---|
| 0.236 | $143.52 |
| 0.382 | $150.13 |
| 0.500 | $158.71 |
| 0.618 | $167.29 |
| 0.786 | $178.46 |
The current price of $141.67 is close to the 0.236 retracement level, suggesting a minor recovery phase. This level might act as a preliminary support point. If the price falls below, it could continue its downward trajectory.
Conclusion
J.B. Hunt Transport Services, Inc. faces a critical juncture based on its technical setup. Holding near the 0.236 Fibonacci Level provides a potential rebound point. However, breaking below this level may signal continued weakness. Investors should consider potential risks from broader market conditions or sectoral challenges. For those considering a long position, it is crucial to look for additional confirmation signs. The stock's behavior in the upcoming weeks will be crucial to determine if this is a consolidation phase or a continuation of a longer-term downtrend.
Smart Data Insight
Master the Perfect Entry & Exit for this Stock
Don't leave your profits to chance. Historically, this stock follows specific seasonal patterns that institutional traders use to maximize returns.
- ✅ Identify the "Golden Buying Window"
- ✅ Avoid high-risk correction cycles
- ✅ Backtested data from the last 20+ years