August 18, 2025 a 03:15 pm
JBHT: Fibonacci Analysis - J.B. Hunt Transport Services, Inc.
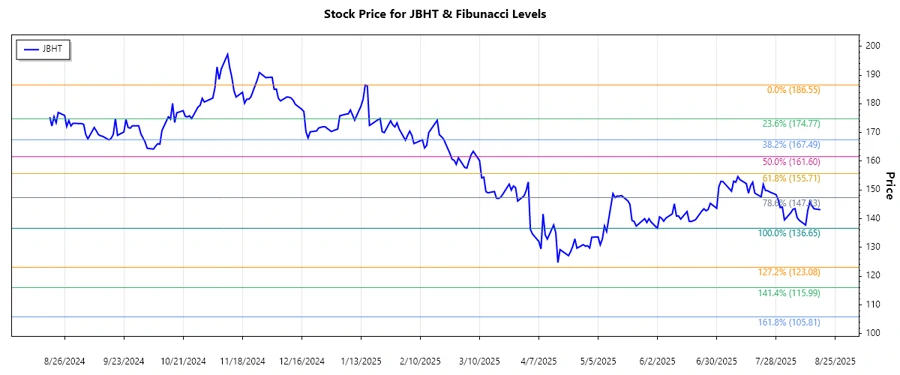
J.B. Hunt Transport Services, Inc., operating within the transportation and logistics sector, has shown significant market movement. This analysis focuses on its recent stock trends and uses a Fibonacci framework to assess potential support and resistance levels. Investors should consider current volatilities and market conditions affecting North American logistics companies.
Fibonacci Analysis
The analysis period captures a downturn in the JBHT stock. The recent price actions signal potential retracement levels critical for investors deciding entry and exit points.
| Metric | Value |
|---|---|
| Start Date | 2025-01-16 |
| End Date | 2025-08-18 |
| High Price & Date | 186.55 on 2025-01-15 |
| Low Price & Date | 136.65 on 2025-06-02 |
| Retracement Level | Price Level |
|---|---|
| 0.236 | 148.52 |
| 0.382 | 157.33 |
| 0.5 | 161.60 |
| 0.618 | 165.87 |
| 0.786 | 171.64 |
The current price of JBHT is at 143.12, which is below the Fibonacci retracement zones, indicating the stock is not currently in a retracement zone but is moving towards potential support at lower levels.
Technical Interpretation: Should the stock price move upwards, these retracement levels could present resistance points. Conversely, falling below the low of 136.65 could suggest further bearish movement.
Conclusion
J.B. Hunt's stock has been experiencing a downtrend, indicative of challenges in the broader market environment. The calculated Fibonacci levels offer insight into potential pivot points for traders. While the stock is currently below key retracement levels, there remain opportunities for gains should the market dynamics shift favorably towards logistic firms. Conversely, sustained movement downward may expose the stock to further declines, highlighting the need for cautious investment based on technical indicators and market sentiment.
Smart Data Insight
Master the Perfect Entry & Exit for this Stock
Don't leave your profits to chance. Historically, this stock follows specific seasonal patterns that institutional traders use to maximize returns.
- ✅ Identify the "Golden Buying Window"
- ✅ Avoid high-risk correction cycles
- ✅ Backtested data from the last 20+ years