June 07, 2026 a 12:46 pm


JBHT: Dividend Analysis - J.B. Hunt Transport Services, Inc.
J.B. Hunt Transport Services, Inc. exhibits a stable dividend profile with a consistent history of payments extending over 39 years, a testament to its commitment to returning value to shareholders. Despite a relatively modest dividend yield of 0.73%, the company's strong financials, marked by a low payout ratio, suggest potential for sustainable dividend growth. Furthermore, a history devoid of dividend cuts underscores its reliable dividend policy.
📊 Overview
J.B. Hunt Transport Services, Inc. operates within the transportation sector. The company's current dividend yield stands at 0.73%, with the current dividend per share at $1.75. The company boasts a history of 39 years of dividend payments and has managed to avoid any cuts or suspensions. This demonstrates financial resilience and consistent cash flow generation capabilities.
| Category | Detail |
|---|---|
| Sector | Transportation |
| Dividend Yield | 0.73% |
| Current Dividend per Share | $1.75 |
| Dividend History | 39 years |
| Last Cut or Suspension | None |
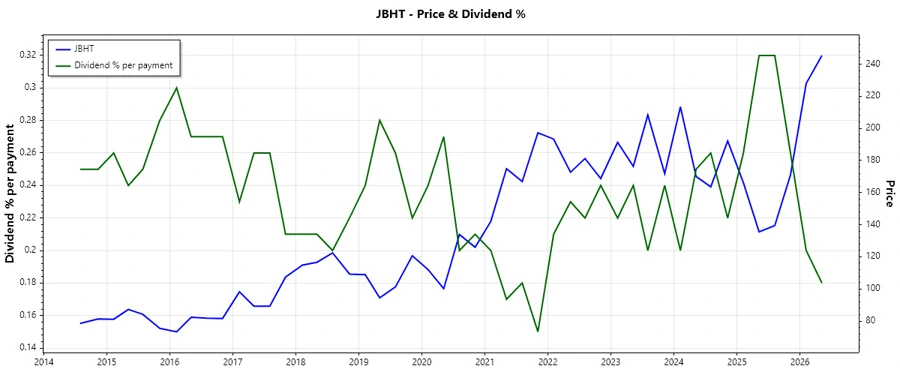
📈 Dividend History
Analyzing the dividend history provides insights into the company's payout consistency and policy. A robust history implies reliability. Continuous dividends over 39 years without cuts reinforce the company's commitment to shareholders.
| Year | Dividend per Share (USD) |
|---|---|
| 2026 | $0.90 |
| 2025 | $1.76 |
| 2024 | $1.72 |
| 2023 | $1.68 |
| 2022 | $1.60 |
📉 Dividend Growth
Dividend growth rates are critical, indicating the company’s ability to increase payouts. Examining these figures over multiple timeframes can hint at future performance potential. Notably, the average dividend growth is 10.26% over 5 years. This shows moderate but steady dividend growth.
| Time | Growth |
|---|---|
| 3 years | 3.23% |
| 5 years | 10.26% |
✅ Payout Ratio
The payout ratio is a critical metric for assessing dividend sustainability. A lower ratio indicates more retained earnings for growth. J.B. Hunt’s EPS-based payout ratio is 26.80%, and its FCF-based ratio is 16.00%, both low, suggesting ample room for future dividend increases while maintaining financial health.
| Key figure | Ratio |
|---|---|
| EPS-based | 26.80% |
| Free cash flow-based | 16.00% |
🗣️ Cashflow & Capital Efficiency
Cash flow metrics provide insight into a company's liquidity and capital efficiency, impacting overall financial health. High free cash flow yields and efficient capital usage indicate operational strength.
| Year | 2025 | 2024 | 2023 |
|---|---|---|---|
| Free Cash Flow Yield | 4.99% | 3.55% | -0.57% |
| Earnings Yield | 3.15% | 3.28% | 3.53% |
| CAPEX to Operating Cash Flow | 43.54% | 58.35% | 106.75% |
| Stock-based Compensation to Revenue | 0.60% | 0.54% | 0.62% |
| Free Cash Flow / Operating Cash Flow Ratio | 56.46% | 41.65% | -6.75% |
| Return on Invested Capital | 9.32% | 8.39% | 10.04% |
The data highlights the importance of cashflow stability. J.B. Hunt exhibits strong cash flow capabilities, as reflected in its free cash flow yield and earnings yield, despite fluctuating CAPEX allocations.
⚠️ Balance Sheet & Leverage Analysis
The balance sheet analysis provides insights into the company's leverage and financial stability. Healthy ratios suggest stability, while high leverage could point to potential risk.
| Year | 2025 | 2024 | 2023 |
|---|---|---|---|
| Debt-to-Equity | 0.53 | 0.45 | 0.47 |
| Debt-to-Assets | 0.23 | 0.21 | 0.22 |
| Debt-to-Capital | 0.35 | 0.31 | 0.32 |
| Net Debt to EBITDA | 1.18 | 1.09 | 1.08 |
| Current Ratio | 0.83 | 1.05 | 1.35 |
| Quick Ratio | 0.81 | 1.03 | 1.32 |
| Financial Leverage | 2.28 | 2.12 | 2.15 |
With a debt-to-equity ratio around 0.47-0.53, J.B. Hunt demonstrates prudent financial management, maintaining a stable balance between debt and equity financing, supporting its financial stability.
🔍 Fundamental Strength & Profitability
Reviewing key profitability metrics, such as return on equity and margins, provides an understanding of how effectively J.B. Hunt employs its resources to generate earnings.
| Year | 2025 | 2024 | 2023 |
|---|---|---|---|
| Return on Equity | 16.78% | 14.22% | 17.75% |
| Return on Assets | 7.35% | 6.69% | 8.27% |
| Net Margin | 4.99% | 4.72% | 5.68% |
| EBIT Margin | 7.21% | 6.94% | 7.80% |
| EBITDA Margin | 13.17% | 13.23% | 13.55% |
| Gross Margin | 13.31% | 17.07% | 17.23% |
| R&D to Revenue | 0% | 0% | 0% |
J.B. Hunt's profitability is evident, with returns on equity frequently above the 15% mark, indicating efficient managerial use of shareholder funds.
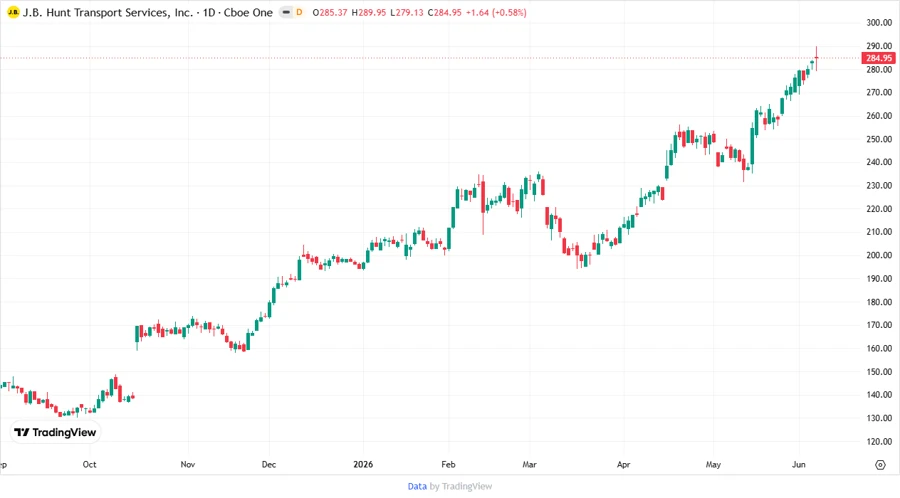
📈 Price Development
🎯 Dividend Scoring System
| Criterion | Score | Bar |
|---|---|---|
| Dividend Yield | 2 | |
| Dividend Stability | 5 | |
| Dividend Growth | 4 | |
| Payout Ratio | 5 | |
| Financial Stability | 4 | |
| Dividend Continuity | 5 | |
| Cashflow Coverage | 3 | |
| Balance Sheet Quality | 4 |
Overall Score: 32/40
📝 Rating
J.B. Hunt Transport Services, Inc. is rated robust due to its steady dividend payments, strong financial foundation, and consistent growth profile. Its conservative payout ratio ensures dividend flexibility, catering to investors seeking stability and modest growth. While the dividend yield lags, the company's strategic management of capital and cash flows bolsters its attractiveness as a sustainable investment.
Smart Data Insight
Master the Perfect Entry & Exit for this Stock
Don't leave your profits to chance. Historically, this stock follows specific seasonal patterns that institutional traders use to maximize returns.
- ✅ Identify the "Golden Buying Window"
- ✅ Avoid high-risk correction cycles
- ✅ Backtested data from the last 20+ years