February 27, 2026 a 11:31 am


JBHT: Dividend Analysis - J.B. Hunt Transport Services, Inc.
J.B. Hunt Transport Services, Inc. presents an intricate dividend profile with a moderate yield. Its stable dividend history and growth reflect robust financial health, but caution is advised due to its lower payout ratios which indicate potential room for future dividend adjustments.
📊 Overview
The current state of J.B. Hunt Transport Services, Inc.'s dividend performance provides a glimpse into its long-term reliability as a dividend-paying entity within the transportation sector.
| Metric | Value |
|---|---|
| Sector | Transportation |
| Dividend Yield | 0.78% |
| Current Dividend per Share | 1.75 USD |
| Dividend History | 39 years |
| Last Cut or Suspension | None |
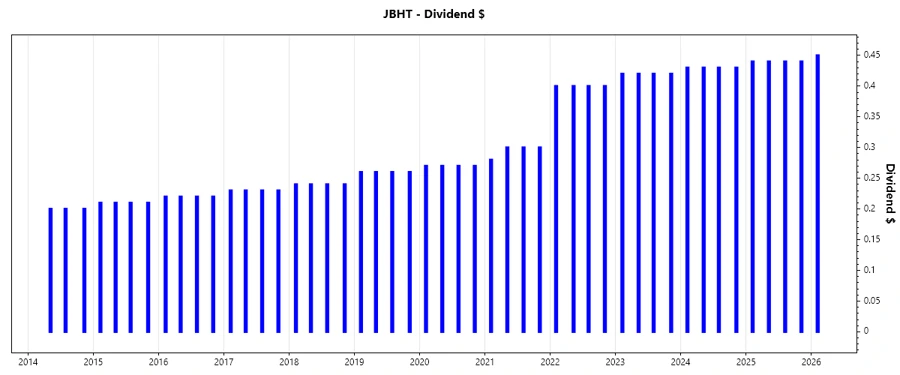
🗣️ Dividend History
With a consistent payment history over 39 years, J.B. Hunt ensures investors about its commitment to shareholder returns even during economic downturns.
| Year | Dividend per Share (USD) |
|---|---|
| 2026 | 0.45 |
| 2025 | 1.76 |
| 2024 | 1.72 |
| 2023 | 1.68 |
| 2022 | 1.60 |
📈 Dividend Growth
The sustained growth in J.B. Hunt's dividends underscores its financial expansion and a commitment to delivering increasing returns to its shareholders.
| Time | Growth |
|---|---|
| 3 years | 3.23% |
| 5 years | 10.26% |
The average dividend growth is 10.26% over 5 years. This shows moderate but steady dividend growth.
✅ Payout Ratio
A lower payout ratio often signifies a conservative approach, allowing room for reinvestment and potential dividend increases.
| Key Figure | Ratio |
|---|---|
| EPS-based | 27.95% |
| Free Cash Flow-based | 17.59% |
Such ratios suggest that the company has ample earnings and cash flow to cover dividends, indicating strong dividend safety.
Cashflow & Capital Efficiency
Understanding the relationship between cash flows and capital utilization is crucial for assessing the company's growth and financial stability.
| Metric | 2023 | 2024 | 2025 |
|---|---|---|---|
| Free Cash Flow Yield | -0.57% | 3.55% | 4.99% |
| Earnings Yield | 3.53% | 3.28% | 3.15% |
| CAPEX to Operating Cash Flow | 106.75% | 58.35% | 43.54% |
The ratios indicate a healthy balance between investing activities and cash flows from operations, supporting the company’s growth potential and funding capabilities.
Balance Sheet & Leverage Analysis
Assessing leverage ratios helps to evaluate J.B. Hunt’s ability to meet debt obligations and its overall financial flexibility.
| Metric | 2023 | 2024 | 2025 |
|---|---|---|---|
| Debt-to-Equity | 47.00% | 44.58% | 52.97% |
The debt structure appears manageable, suggesting stable leverage and thus a strong capacity to undertake additional debt if necessary.
Fundamental Strength & Profitability
Profitability ratios shed light on the firm’s efficiency in generating profits and optimal financial performance.
| Metric | 2023 | 2024 | 2025 |
|---|---|---|---|
| Return on Equity | 17.75% | 14.22% | 16.78% |
The profitability metrics confirm a strong operating model that efficiently manages resources to generate impressive returns.
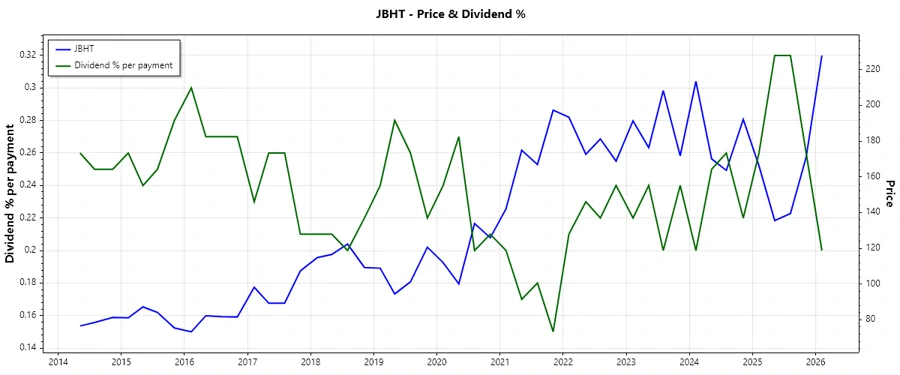
📉 Price Development
💼 Dividend Scoring System
| Category | Description | Score |
|---|---|---|
| Dividend Yield | Reflects income generation from dividends | 3 |
| Dividend Stability | Continuous dividend payments history | 4 |
| Dividend Growth | Reflects growth in dividend payments | 3 |
Total Score: 28/40
Rating
J.B. Hunt Transport Services, Inc. demonstrates a solid dividend profile suitable for income-focused investors preferring stable returns with moderate growth potential, given its robust financial fundamentals and consistent payout history.
Smart Data Insight
Master the Perfect Entry & Exit for this Stock
Don't leave your profits to chance. Historically, this stock follows specific seasonal patterns that institutional traders use to maximize returns.
- ✅ Identify the "Golden Buying Window"
- ✅ Avoid high-risk correction cycles
- ✅ Backtested data from the last 20+ years