February 20, 2026 a 12:46 pm

JBHT: Dividend Analysis - J.B. Hunt Transport Services, Inc.
J.B. Hunt Transport Services, Inc., a leader in the transportation sector, showcases a reliable dividend history and consistent payout strategy. With its established market presence and resilience through various economic cycles, the company has maintained its dividend payouts diligently. Despite a relatively low dividend yield, the growth prospects and stability offer attractive opportunities for long-term investors.
📊 Overview
The company's dividend profile indicates a 39-year history without cuts or suspensions, demonstrating a strong commitment to returning value to shareholders. The current dividend yield is anchored at 0.78%, which, while not exceptionally high, reflects its sustainable growth strategy in a capital-intensive industry.
| Metric | Detail |
|---|---|
| Sector | Transportation |
| Dividend yield | 0.78% |
| Current dividend per share | $1.76 USD |
| Dividend history | 39 years |
| Last cut or suspension | None |
🗣️ Dividend History
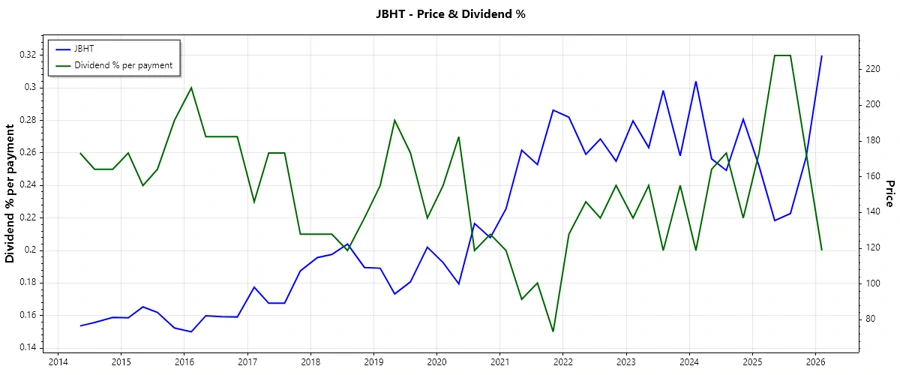
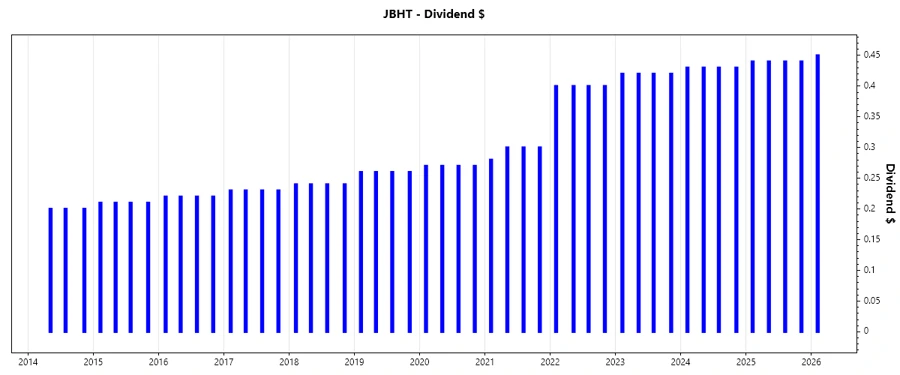
J.B. Hunt Transport Services has sustained a steady dividend payout reflected in its 39-year streak, showcasing its capacity to weather economic downturns while preserving shareholder returns. This historical consistency enhances investor confidence and indicates robust financial health.
| Year | Dividend per Share |
|---|---|
| 2026 | $0.45 |
| 2025 | $1.76 |
| 2024 | $1.72 |
| 2023 | $1.68 |
| 2022 | $1.60 |
📈 Dividend Growth
The company’s dividend growth underscores moderate but stable expansion, with a 5-year growth rate of 10.26%. Such incremental growth reflects a focused reinvestment strategy, balancing dividend payouts with necessary capital expenditures for sustained expansion.
| Time | Growth |
|---|---|
| 3 years | 3.23% |
| 5 years | 10.26% |
The average dividend growth is 10.26% over 5 years. This shows moderate but steady dividend growth.
📉 Payout Ratio
J.B. Hunt’s payout ratio stands at 28.10% based on EPS and 21.22% on free cash flow, suggesting a conservative and sustainable approach to dividend distribution that allows room for potential increases while safeguarding the company's financial stability.
| Key figure ratio | Percentage |
|---|---|
| EPS-based | 28.10% |
| Free cash flow-based | 21.22% |
A payout ratio of 28.10% (EPS) and 21.22% (FCF) shows a well-managed dividend policy that avoids overstretching resources, preserving cash for operational and strategic projects.
✅ Cashflow & Capital Efficiency
Examining free cash flow yield, which stands at 3.67%, alongside the earnings yield of 2.78%, showcases an efficient capital allocation. Meanwhile, the CAPEX to operating cash flow ratio remains at a strategic 50.96%, emphasizing infrastructural reinvestment essential for sustained industry competitiveness.
| Year | 2025 | 2024 | 2023 |
|---|---|---|---|
| Free Cash Flow Yield | 0% | 3.55% | -0.57% |
| Earnings Yield | 3.15% | 3.28% | 3.53% |
| CAPEX to Operating Cash Flow | - | 58.35% | 106.75% |
| Stock-based Compensation to Revenue | - | 0.54% | 0.62% |
| Free Cash Flow / Operating Cash Flow Ratio | - | 41.65% | -6.75% |
The metrics reflect a company with a solid framework for capital efficiency and a stable cash flow support system, although room for improvement in free cash flow maximization is present.
⚠️ Balance Sheet & Leverage Analysis
J.B. Hunt maintains a controlled leverage with a debt-to-equity ratio of 0.41 and a net debt to EBITDA at 0.92, indicating substantial financial flexibility and a manageable debt profile critical for swift adaptability to market changes.
| Year | 2025 | 2024 | 2023 |
|---|---|---|---|
| Debt-to-Equity | 0.41 | 0.45 | 0.47 |
| Debt-to-Assets | 0.19 | 0.21 | 0.22 |
| Debt-to-Capital | 0.29 | 0.31 | 0.32 |
| Net Debt to EBITDA | 0.92 | 1.09 | 1.08 |
| Current Ratio | 0.83 | 1.06 | 1.35 |
| Quick Ratio | 0.83 | 1.03 | 1.32 |
| Financial Leverage | 2.22 | 2.12 | 2.15 |
These figures demonstrate financial stability with balanced leverage practices, affording the company protection from potential solvency issues and promoting future handling of market variations.
✅ Fundamental Strength & Profitability
The Return on Equity (ROE) for J.B. Hunt stands at 16.33%, reflecting efficient management of shareholder equity to generate profits. Similarly, a healthy Return on Assets (ROA) of 7.55% signifies effective asset utilization to generate revenues.
| Year | 2025 | 2024 | 2023 |
|---|---|---|---|
| Return on Equity | 16.78% | 14.22% | 17.75% |
| Return on Assets | 7.55% | 6.69% | 8.27% |
| Net Margin | 4.99% | 4.72% | 5.68% |
| EBIT Margin | 7.21% | 6.94% | 7.80% |
| EBITDA Margin | 13.17% | 13.23% | 13.55% |
| Gross Margin | 10.52% | 17.07% | 17.23% |
| Research & Development to Revenue | 0% | 0% | 0% |
From profitability to margin stability, J.B. Hunt displays strength across fundamental areas, supporting its reputation as a resilient and growth-oriented firm.
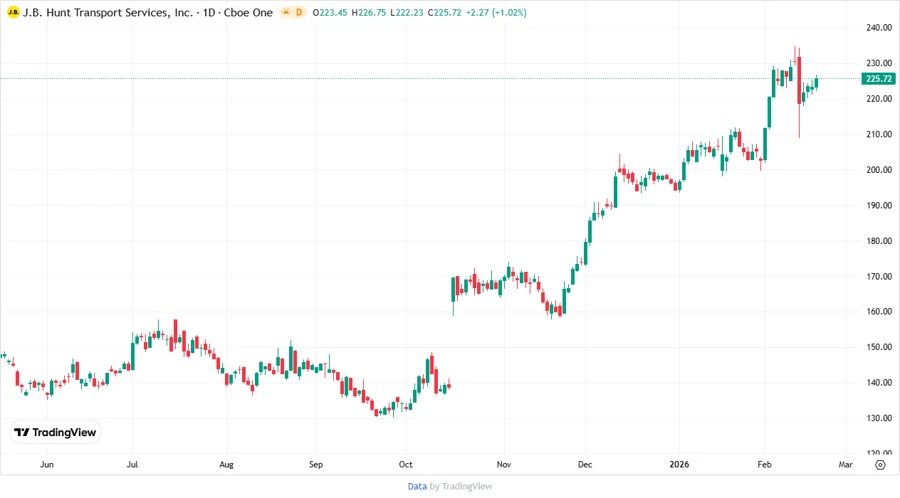
📈 Price Development
Dividend Scoring System 📊
| Category | Description | Score |
|---|---|---|
| Dividend yield | Low yield but consistent payments | |
| Dividend Stability | 39 years of continued payments | |
| Dividend growth | Moderate growth over 5 years | |
| Payout ratio | Conservative payout ratios | |
| Financial stability | Strong debt management | |
| Dividend continuity | No cuts or suspensions | |
| Cashflow Coverage | Robust cash flow allocation | |
| Balance Sheet Quality | Well-managed liabilities |
Total Score: 32/40
Rating 👐
J.B. Hunt Transport Services, Inc. maintains a resilient dividend profile with strong fundamentals, ensuring consistent shareholder returns and a steady growth outlook. This positions it as a worthy investment for those seeking stability blended with mild growth potential in the transportation industry.