July 27, 2025 a 03:31 am


JBHT: Dividend Analysis - J.B. Hunt Transport Services, Inc.
J.B. Hunt Transport Services, Inc. has shown a commendable commitment to returning value to its shareholders through stable dividends over nearly four decades. With a current dividend yield of 1.17% and a consistent history of annual payments, the company's dividend policy aligns with its strategic growth and profitability framework. As a logistics leader, maintaining a low payout ratio implies ample room for future dividend growth. Investors looking for steady income and growth potential might find this stock attractive. 📊
Overview
| Feature | Details |
|---|---|
| Sector | Transport & Logistics |
| Dividend Yield | 1.17% |
| Current Dividend Per Share | $1.72 |
| Dividend History | 38 years |
| Last Cut or Suspension | None |
Dividend History
J.B. Hunt has demonstrated a strong historical commitment to dividends, reflected in nearly four decades of uninterrupted payouts. This history showcases the company's resilience and shareholder-centered approach. Investing in a company with a consistent dividend history offers reassurance of financial health and management's confidence in future earnings.
| Year | Dividend Per Share (USD) |
|---|---|
| 2025 | 1.32 |
| 2024 | 1.72 |
| 2023 | 1.68 |
| 2022 | 1.60 |
| 2021 | 1.18 |
Dividend Growth
Steady growth in dividends over time is an indicator of a firm's financial health and its capacity to return excess cash to shareholders. Intensive analysis predicts moderate growth prospects, confirming J.B. Hunt's robust operational strategy.
| Time | Growth |
|---|---|
| 3 years | 13.38% |
| 5 years | 10.59% |
The average dividend growth is 10.59% over 5 years. This shows moderate but steady dividend growth, aligning with the company’s focus on enhancing shareholder value. 📈
Payout Ratio
Payout ratios help determine the sustainability of a dividend. J.B. Hunt's careful balancing of EPS and FCF ratios indicates the capacity to sustain and potentially increase dividend payouts without pressuring financial reserves. This balance is essential for assessing long-term dividend viability.
| Key Figure | Ratio |
|---|---|
| EPS-based | 30.85% |
| Free cash flow-based | 27.76% |
With an EPS payout ratio of 30.85% and an FCF-based ratio of 27.76%, the company demonstrates prudent dividend payment practices, ensuring it does not over-extend its financial commitments. ✅
Cashflow & Capital Efficiency
Analyzing cashflow and capital efficiency provides insights into the company’s ability to generate cash and how effectively it utilizes capital investments. J.B. Hunt, with steady cash flow metrics, displays operational stability and efficient capital management.
| Metric | 2024 | 2023 | 2022 |
|---|---|---|---|
| Free Cash Flow Yield | 3.55% | -0.57% | 1.30% |
| Earnings Yield | 3.28% | 3.53% | 5.34% |
| CAPEX to Operating Cash Flow | 58.35% | 106.75% | 86.71% |
| Stock-based Compensation to Revenue | 0.54% | 0.62% | 0.52% |
| Free Cash Flow / Operating Cash Flow Ratio | 41.65% | -6.75% | 13.29% |
J.B. Hunt's cash flow metrics depict a strong foundation for future expansions and shareholder returns, though fluctuations in certain years need monitoring. ⚠️
Balance Sheet & Leverage Analysis
A thorough understanding of leverage is crucial for assessing long-term financial stability. By managing moderate debt levels and maintaining appropriate liquidity ratios, J.B. Hunt ensures operational agility and minimizes fiscal vulnerability.
| Metric | 2024 | 2023 | 2022 |
|---|---|---|---|
| Debt-to-Equity | 0.368 | 0.470 | 0.429 |
| Debt-to-Assets | 0.178 | 0.226 | 0.203 |
| Debt-to-Capital | 0.269 | 0.320 | 0.300 |
| Net Debt to EBITDA | 0.89 | 1.08 | 0.77 |
| Current Ratio | 1.055 | 1.172 | 1.410 |
| Quick Ratio | 1.031 | 1.148 | 1.384 |
| Financial Leverage | 2.071 | 2.081 | 2.111 |
The balance sheet metrics showcase a well-balanced debt structure, providing J.B. Hunt with a sound platform for sustaining growth initiatives and enhancing shareholder returns. 📊
Fundamental Strength & Profitability
A focus on profitability ratios reveals the company’s operational efficiency and capability to generate profits from its assets. J.B. Hunt continues to exemplify substantial returns, maintaining beneficial margins across key metrics.
| Metric | 2024 | 2023 | 2022 |
|---|---|---|---|
| Return on Equity | 14.22% | 17.75% | 26.44% |
| Return on Assets | 6.87% | 8.53% | 12.52% |
| Net Margin | 4.72% | 5.68% | 6.54% |
| EBIT Margin | 6.94% | 7.80% | 9.00% |
| EBITDA Margin | 13.23% | 13.73% | 13.35% |
| Gross Margin | 10.38% | 18.68% | 16.69% |
| Research & Development to Revenue | 0% | 0% | 0% |
The results of the company’s profitability measures suggest J.B. Hunt has maintained its market competitiveness through strategic management and operational efficiency. 📈
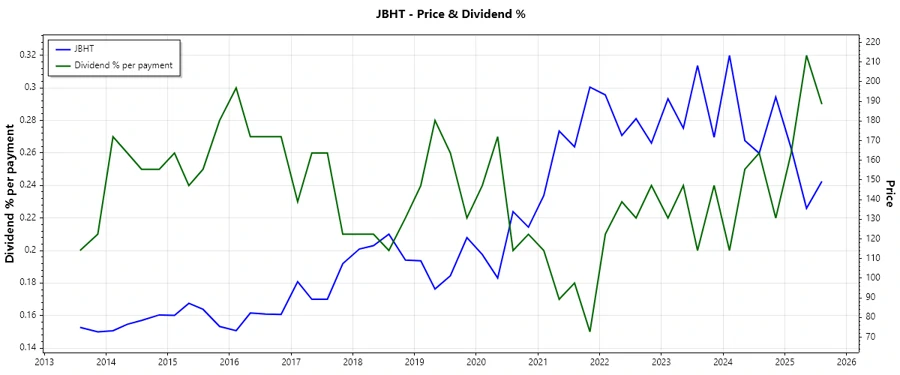
Price Development
Dividend Scoring System
| Category | Score | Score Bar |
|---|---|---|
| Dividend Yield | 3 | |
| Dividend Stability | 5 | |
| Dividend Growth | 4 | |
| Payout Ratio | 4 | |
| Financial Stability | 4 | |
| Dividend Continuity | 5 | |
| Cashflow Coverage | 3 | |
| Balance Sheet Quality | 4 |
Overall Score: 32/40
Rating
In summary, J.B. Hunt Transport Services, Inc., offers a sound investment opportunity for those seeking a balance between stable income and growth potential. With robust dividend history, reliable payout ratios, and strong financial stability, it represents an appealing choice for dividend-focused investors. 📈
Smart Data Insight
Master the Perfect Entry & Exit for this Stock
Don't leave your profits to chance. Historically, this stock follows specific seasonal patterns that institutional traders use to maximize returns.
- ✅ Identify the "Golden Buying Window"
- ✅ Avoid high-risk correction cycles
- ✅ Backtested data from the last 20+ years