
October 31, 2026 a 09:31 am


Industrial Stocks - Performance Analysis
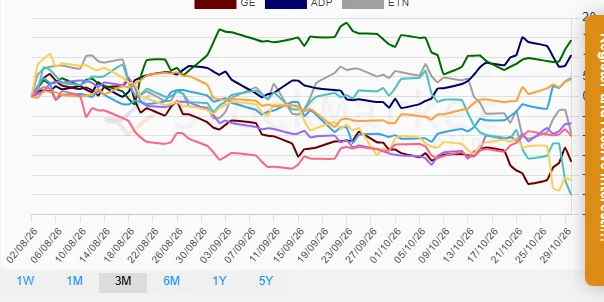
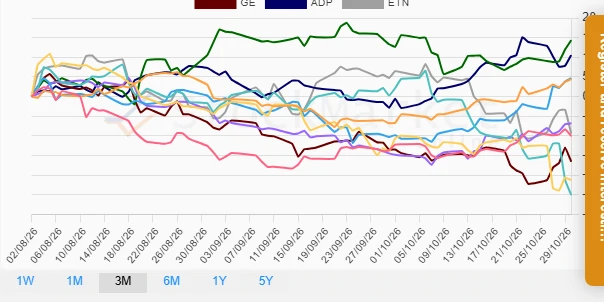
In the industrial sector, the examination of varied stocks over multiple recent timeframes reveals both volatility and opportunity. This detailed analysis aims to elucidate trends and recognize the best and worst performing stocks over weekly, monthly and quarterly intervals. The findings highlight significant movements within the industry and contribute to informed investment strategies.
📊 Industrial Stocks Performance One Week
Within the past week, various stocks in the industrial sector showcased different trajectories, reflecting market conditions and company-specific news. The top performer this week is UPS, posting a notable gain of 7.06%, while CAT showed a significant decline at -9.24%. Such disparities emphasize an unsettled marketplace where select companies outperform, contrasting starkly with underperformers.
| Stock | Performance (%) | Performance |
|---|---|---|
| UPS | 7.06% | |
| GE | 5.72% | |
| RTX | 4.59% | |
| DE | 4.52% | |
| UNP | 3.77% | |
| ETN | 1.33% | |
| HON | -1.26% | |
| ADP | -3.34% | |
| BA | -8.67% | |
| CAT | -9.24% |
📊 Industrial Stocks Performance One Month
The past month has exhibited pronounced fluctuations among industrial stocks. UPS again leads with a substantial 14.51%, evidencing robust performance, whereas CAT's further descent by -27.19% indicates potential sectorial or company-specific hardships.
| Stock | Performance (%) | Performance |
|---|---|---|
| UPS | 14.51% | |
| UNP | 11.14% | |
| ADP | 11.08% | |
| RTX | 7.99% | |
| HON | 2.20% | |
| DE | 1.65% | |
| GE | -3.06% | |
| ETN | -15.86% | |
| BA | -10.61% | |
| CAT | -27.19% |
📊 Industrial Stocks Performance Three Months
Over the three-month span, DE has rose prominently with a remarkable 14.32% gain, despite a general downward trend for other stocks like BA and CAT registering significant negative performances of -21.27% and -25.03%, respectively. These shifts highlight the varying resilience or susceptibility to prevailing market forces among industrial entities.
| Stock | Performance (%) | Performance |
|---|---|---|
| DE | 14.32% | |
| ADP | 10.54% | |
| UPS | 4.69% | |
| UNP | 4.45% | |
| RTX | -6.82% | |
| ETN | -9.38% | |
| HON | -10.06% | |
| GE | -16.54% | |
| BA | -21.27% | |
| CAT | -25.03% |
✅ Summary
The industrial sector continues to reveal marked disparities, exemplified by UPS's consistent positive trajectory contrasted with CAT's prolonged negative decline across the reviewed periods. Investors should note the resilience of certain stocks like DE and UPS while staying cautious regarding underperformance indicators and potential structural challenges in companies like CAT and BA.
Smart Data Insight
Master the Perfect Entry & Exit for this Stock
Don't leave your profits to chance. Historically, this stock follows specific seasonal patterns that institutional traders use to maximize returns.
- ✅ Identify the "Golden Buying Window"
- ✅ Avoid high-risk correction cycles
- ✅ Backtested data from the last 20+ years