May 31, 2025 a 09:31 am


Industrial Stocks - Performance Analysis
Assessing the industrial sector's stock performance offers valuable insights into market dynamics amid economic fluctuations. This analysis delves into weekly, monthly, and quarterly performances, identifying leaders and laggards to assist in informed investment decision-making.
📊 Industrial Stocks Performance One Week
| Stock | Performance (%) | Performance |
|---|---|---|
| GE | 5.56% | |
| RTX | 3.11% | |
| BA | 2.48% | |
| UPS | 2.30% | |
| ADP | 1.39% | |
| HON | 2.10% | |
| CAT | 1.38% | |
| UNP | -0.19% | |
| ETN | -0.23% | |
| DE | -0.73% |
📊 Industrial Stocks Performance One Month
| Stock | Performance (%) | Performance |
|---|---|---|
| GE | 19.11% | |
| BA | 12.75% | |
| CAT | 10.60% | |
| ADP | 8.69% | |
| HON | 7.46% | |
| ETN | 6.16% | |
| DE | 5.57% | |
| UNP | 3.80% | |
| RTX | 7.08% | |
| UPS | 3.46% |
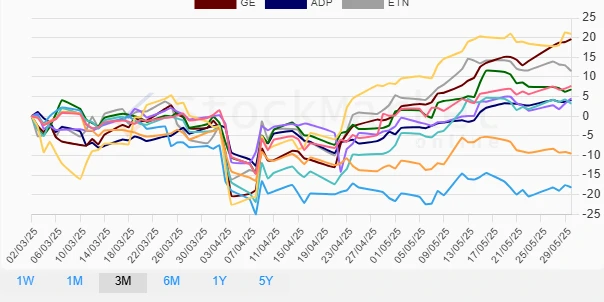
📊 Industrial Stocks Performance Three Months
| Stock | Performance (%) | Performance |
|---|---|---|
| GE | 19.61% | |
| BA | 20.94% | |
| ETN | 11.49% | |
| DE | 6.78% | |
| RTX | 4.50% | |
| ADP | 4.09% | |
| CAT | 3.19% | |
| HON | 7.69% | |
| UNP | -9.50% | |
| UPS | -18.12% |
📝 Summary
The industrial sector has exhibited diverse performance, with specific leaders emerging over various time frames. General Electric (GE) surfaced as a consistent performer across all time intervals, showcasing resilience and robust fundamentals. Conversely, UPS experienced significant negative pressure over the quarter, necessitating a reassessment of strategic positioning. Investors may consider maintaining or increasing exposure to outperformers while closely monitoring and addressing underperformance factors to optimize portfolio strategies.
Smart Data Insight
Master the Perfect Entry & Exit for this Stock
Don't leave your profits to chance. Historically, this stock follows specific seasonal patterns that institutional traders use to maximize returns.
- ✅ Identify the "Golden Buying Window"
- ✅ Avoid high-risk correction cycles
- ✅ Backtested data from the last 20+ years